User Analytics
Understanding usage analytics in Squadbase
What is User Analytics?
User Analytics helps you analyze how users interact with your project. It visualizes access patterns to your Production environment, giving you insights into how your application is being used.
Key Features
- Production Environment Tracking: Monitors access to your production environment only
- Page View Analysis: Displays daily page view counts in an easy-to-read graph
- Flexible Time Periods: Choose from weekly, monthly, or other time ranges
- Sorting Options: Sort data by activity level
Important Note
Production Environment Only: Analytics tracks only Production environment access. Preview environment traffic is not included in the data.
Using the Analytics Dashboard
How to Access
Choose Your Access Method
There are two ways to view analytics:
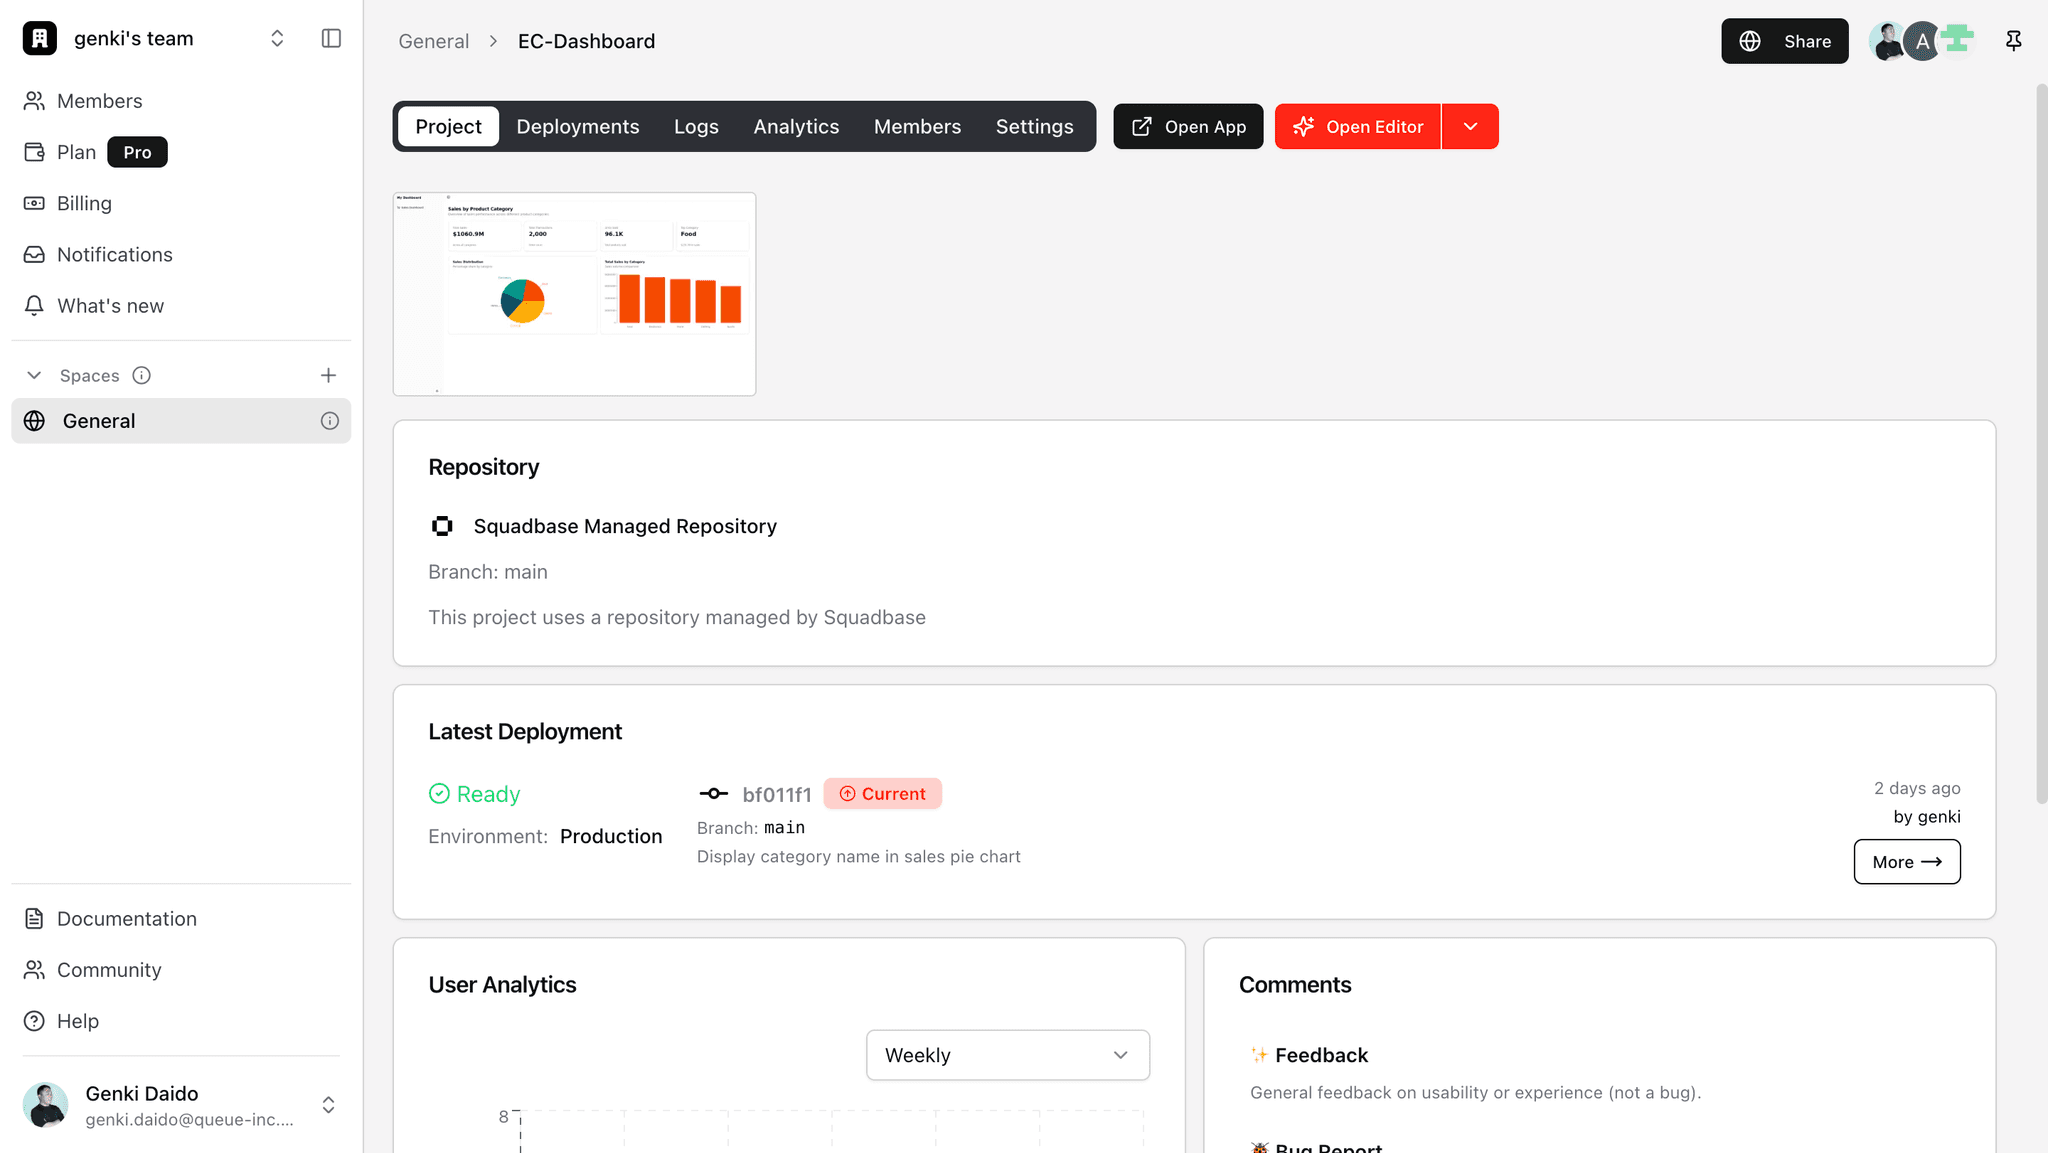
Option 1: Analytics Tab
- Click the Analytics tab for a comprehensive analytics view
Option 2: Project Tab
- Click the Project tab
- Scroll down to the User Analytics section for a quick overview
Dashboard Layout
User Analytics Section
Time Period Selection:
- Select a time period from the dropdown menu
- Options include Weekly, Monthly, and more
- The selected date range is displayed
- Example: 10/14 ~ 10/20
Page Views Graph:
- X-axis: Date
- Y-axis: Page view count
- Visualizes access patterns in an intuitive graph format
Sorting Options:
- Choose sort order from the dropdown menu
- Example: "Most Active" sorts by highest activity
Understanding Your Data
Interpreting Page Views
What is a Page View?
- The number of times users have viewed a page
- Multiple page views by the same user are counted separately
Reading the Graph:
- Identify Trends: Monitor daily increases and decreases in traffic
- Spot Peak Times: Understand when your app sees the most activity
- Detect Anomalies: Sudden changes may indicate issues worth investigating
Practical Use Cases
1. Monitoring Dashboard Usage:
- Track increased traffic after updating dashboards built with Squadbase
2. Early Problem Detection:
- Sudden drop in access → Possible service outage
- Unusual patterns → Signs of potential issues
3. Understanding Usage Patterns:
- Day-of-week access trends
- Time-of-day usage patterns
Tips & FAQ
Q: Can I view Preview environment analytics?
No, analytics only tracks the Production environment. Preview environments are for development and testing purposes and are excluded from tracking.
Q: Is the data available in real-time?
There may be a slight delay in data updates. To see the latest data, try refreshing the page.
Q: Can I export the graph data?
Direct export functionality is not currently available. Consider taking screenshots or integrating external analytics tools if you need exportable data.
Q: Why does my access count show 0?
This could happen for several reasons:
- Your project hasn't been deployed yet
- No one has accessed the Production environment
- Data is still being processed
Best Practices
- Check Regularly: Make it a habit to review your analytics weekly
- Monitor After Deployments: Watch for traffic changes after new deployments
- Act on Anomalies: If you notice a sudden drop in traffic, check the Logs tab for errors immediately
- Analyze Multiple Time Periods: Look at both weekly and monthly trends to understand long-term patterns
Summary
The analytics feature makes it easy to understand how your application is being used. Regular monitoring and early detection of anomalies help maintain and improve the quality of your dashboards.