Editor
Create and edit dashboards in Squadbase's integrated editor
What is the Editor?
The Editor is where you create and edit dashboards in Squadbase. With Squadbase AI at your fingertips, you can build dashboards, preview changes, and publish—all from a single screen.
Key Features
- AI-Powered: Squadbase AI assists you throughout the dashboard creation process
- Real-Time Preview: See your changes instantly as you work
- Unified Workspace: Edit, preview, and deploy from one interface
- Thread Management: Keep track of your AI conversation history for easy reference
Opening the Editor
You can access the Editor from two locations.
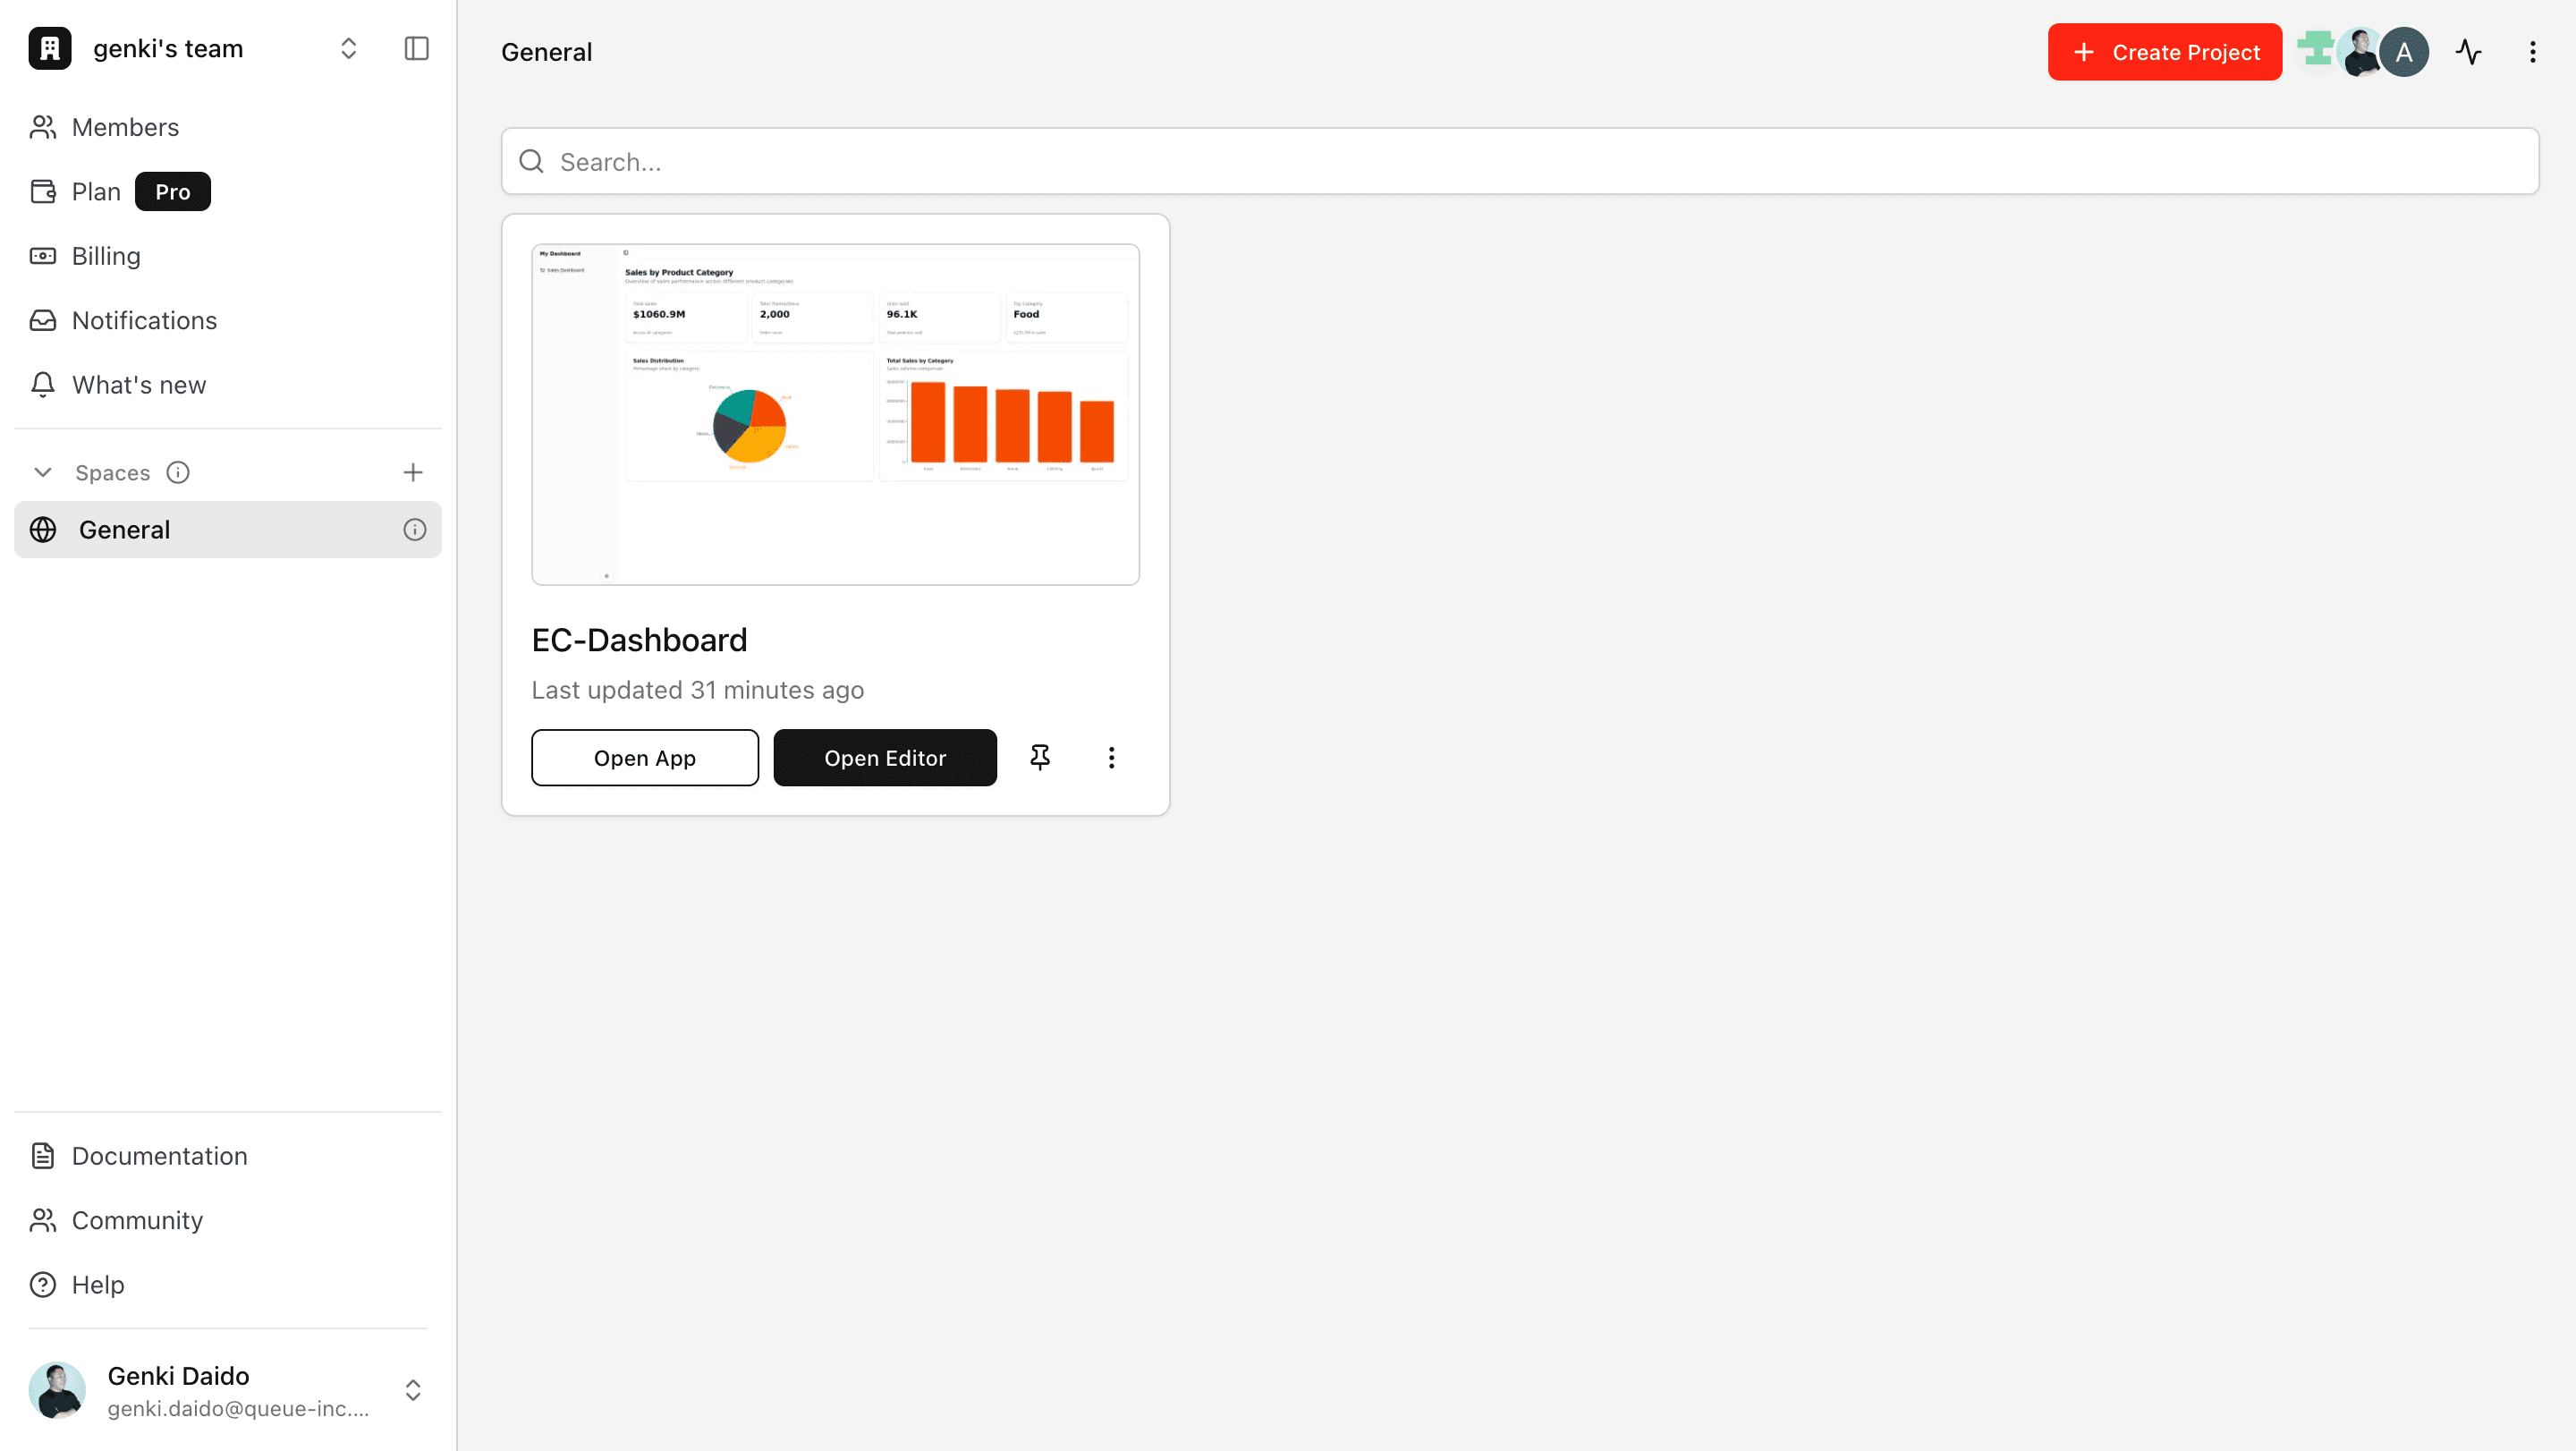
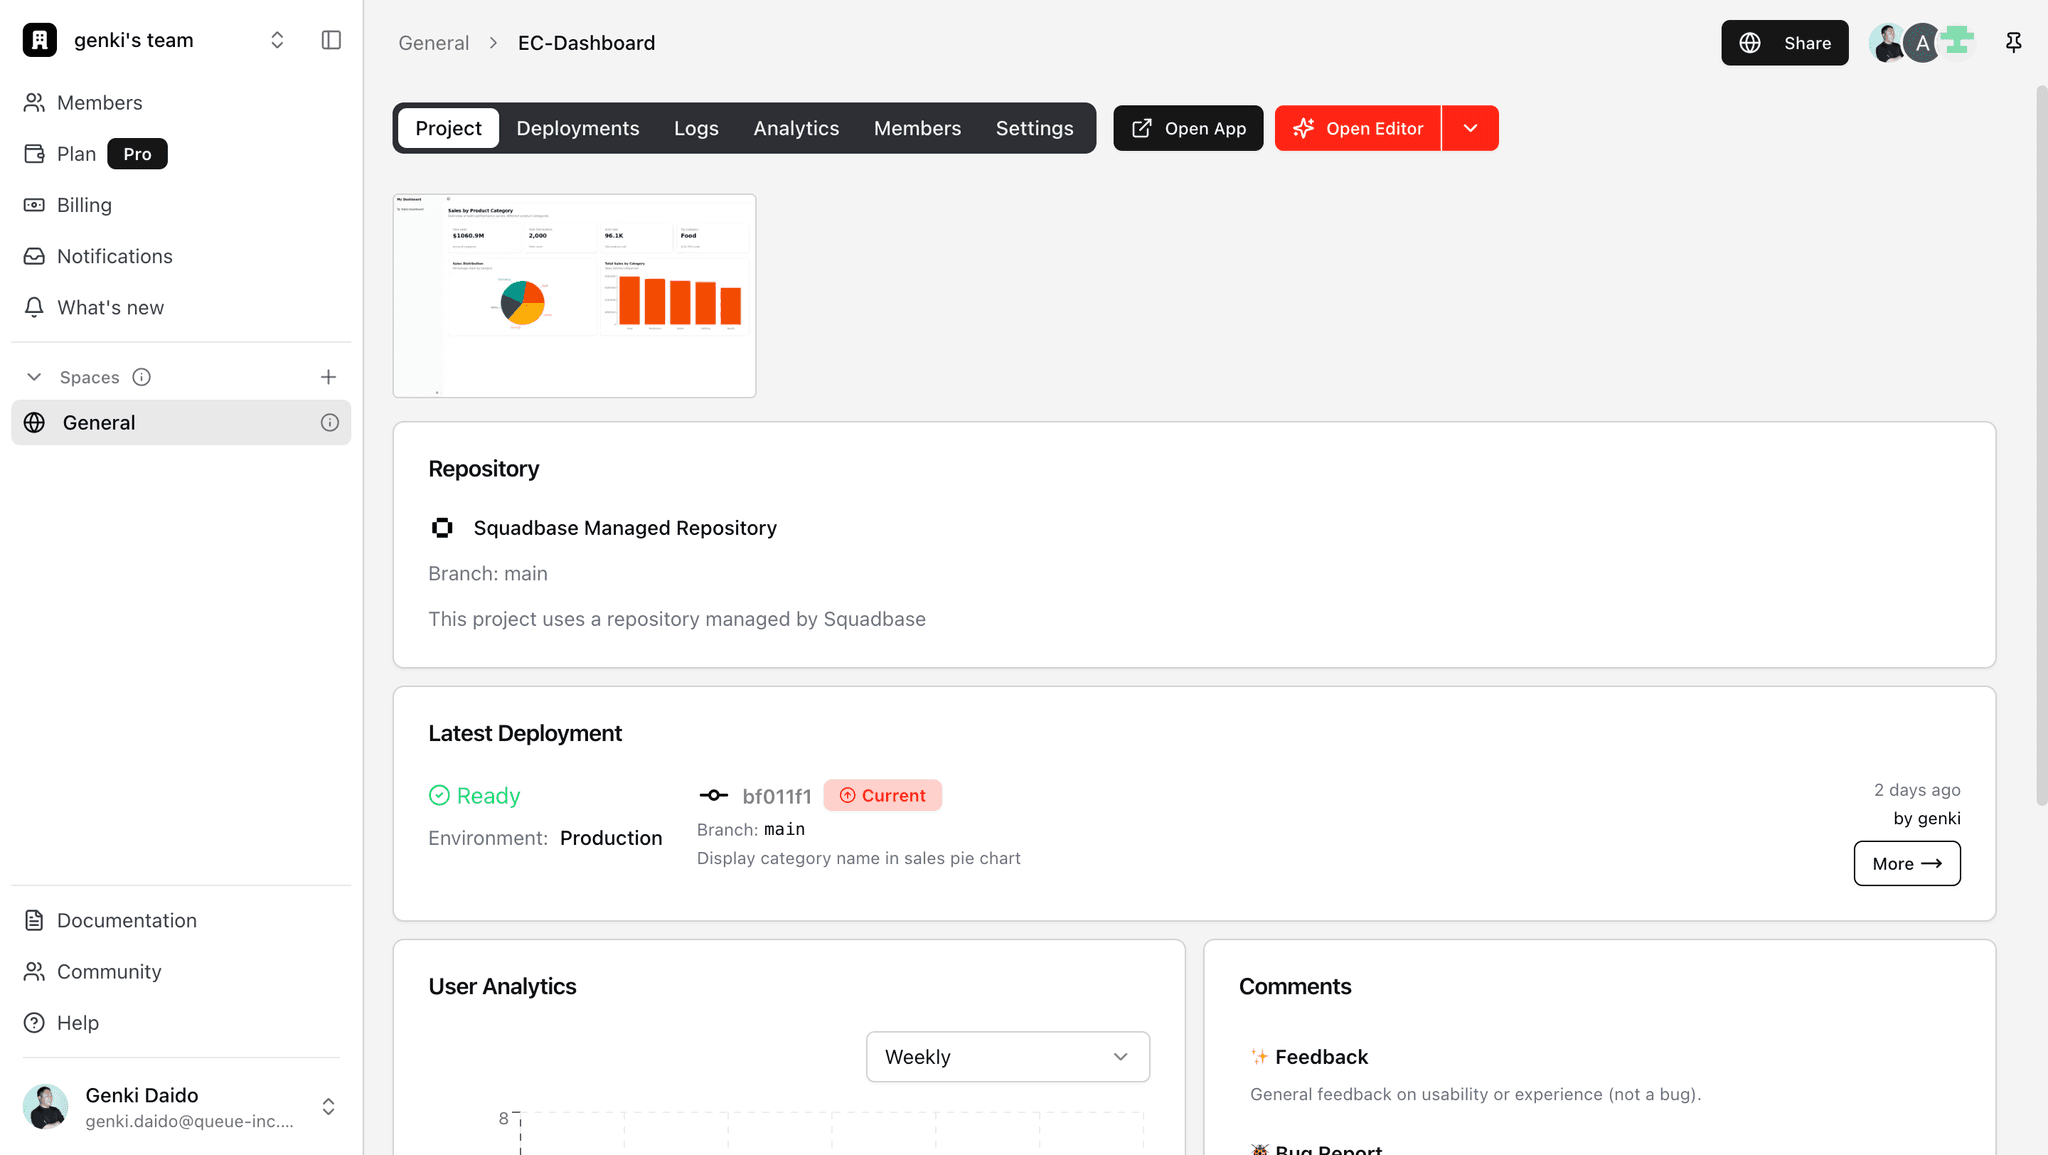
Click "Open Editor"
Click the "Open Editor" button in either location.
The Editor opens in a new tab, so you can view both the project details and the Editor simultaneously.
Screen Layout
The screen is divided into two main sections.
Chat Area
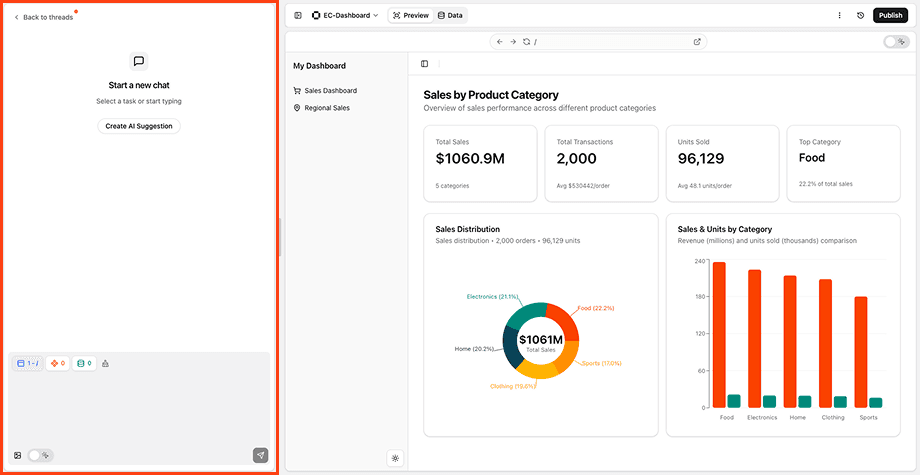
Top Section: Thread Management
| Element | Description |
|---|---|
| Threads | View your past chat history at a glance |
| "Create AI Suggestion" Button | Let Squadbase AI explore your data and suggest analysis ideas |
| "+" Button | Start a new thread |
Bottom Section: Chat Input
| Element | Description |
|---|---|
| "Page" Button | Specify which dashboard page to edit |
| "Component" Button | Select specific dashboard elements to modify |
| "Data" Button | Choose which data source to work with |
| "Clear" Button | Clear all context selections |
| "Image" Button | Attach images as context for the AI (you can also paste images directly into the chat input) |
| "Element Selector" Toggle | When enabled, click elements on the dashboard to select them for editing |
| "Send" Button | Submit your message to the AI (changes to a stop button while the AI is responding) |
Dashboard Area
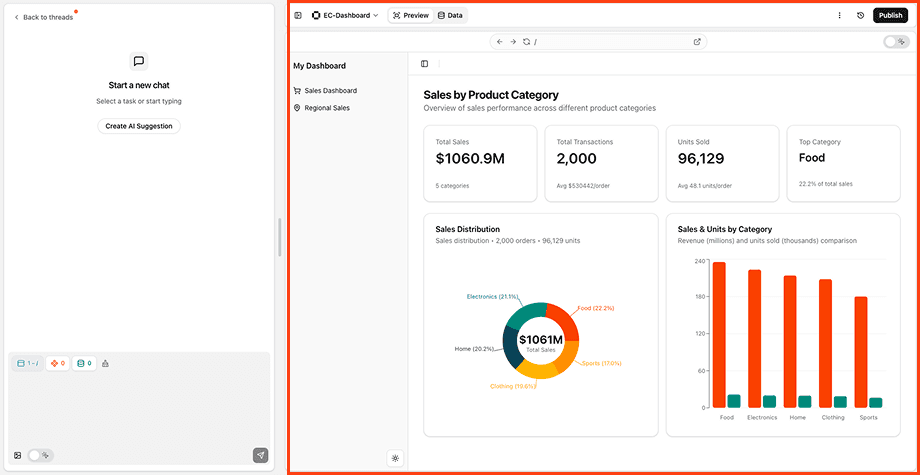
Header
| Element | Description |
|---|---|
| Collapse Button | Collapse the chat area |
| Project Name | Edit the project name or navigate back to Home or Space |
| Preview Tab | View the dashboard preview |
| Data Tab | Browse stored data and add data sources |
| "..." Menu | Check the current environment or switch to Developer Mode |
| "History" Button | View saved dashboard versions (use "Restore Here" to revert to a previous state) |
| "Publish to Team" Button | Publish your dashboard (initiates the publishing workflow in the chat) |
Dashboard Preview
| Element | Description |
|---|---|
| Navigation Buttons | Go back, forward, or reload the dashboard |
| URL Bar | Displays the current preview page URL |
| "Preview" Button | Show only the dashboard in full view |
| Element Selector Toggle | Click elements on the dashboard to select them for editing |
| Collapse Button | Collapse the dashboard sidebar |
Developer Mode
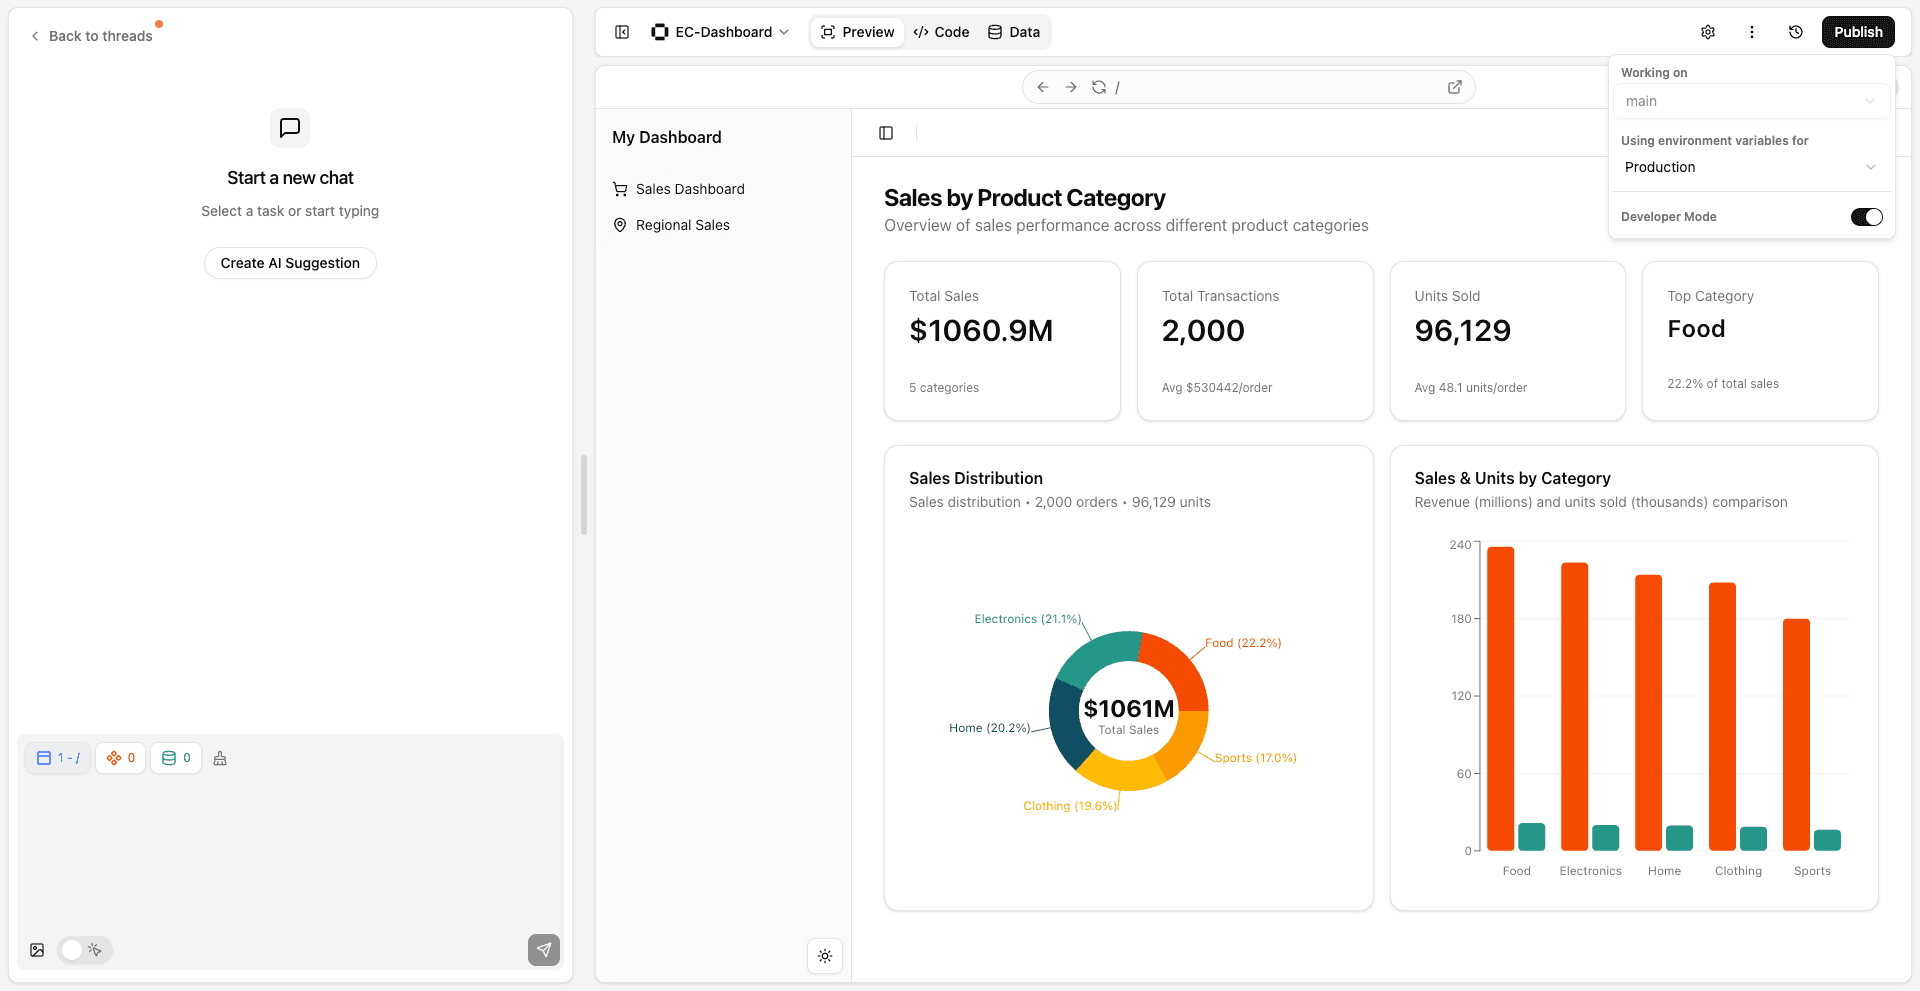
Enable Developer Mode from the "..." menu in the dashboard area header to access additional features.
| Element | Description |
|---|---|
| Code Tab | View the source code that powers your dashboard |
| "Settings" Button | Access GitHub connection details, environment settings, knowledge base, and outbound IP information |
Tips & FAQ
Best Practices
-
Make the Most of AI
- Ask questions whenever you're unsure about something
- Use the "Generate AI Suggestions" button to get improvement ideas and analysis themes
- Organize your work using threads to maintain or separate context
-
Preview Frequently
- Always check changes in the preview after modifying the UI
- Test navigation between different pages
-
Publish Regularly
- Publish your work to the team after making significant changes to keep everyone up to date