Setting Up Your Development Environment
Build an Optimal Workspace with GitHub Codespaces
Objective: Learn to build and run Streamlit apps in GitHub Codespaces, a browser-based development environment.
Requirements: A GitHub account with a payment method registered (a free tier is available).
For Experienced Developers: If you have a local Python environment, you can skip this chapter. However, we recommend GitHub Codespaces to eliminate environment inconsistencies, which is valuable for team collaboration.
Why GitHub Codespaces?
Setting up a development environment is a common hurdle, often causing frustration due to OS and hardware differences. GitHub Codespaces solves this by providing a ready-to-use, containerized development environment that runs in your browser.
https://github.com/features/codespaces
Key Benefits:
- Instant Setup: Your environment is ready in minutes.
- Platform Independent: A consistent Linux-based environment, regardless of your local machine.
- Accessible Anywhere: Requires only a browser.
- Full VS Code Experience: Includes the terminal, debugger, and extensions.
- Seamless GitHub Integration: Create a Codespace for any branch or pull request.
- Standardized Environments: Define your environment as code (
devcontainer.json) for team-wide consistency.
Getting Started with GitHub Codespaces
Step 1: Prepare Your GitHub Account
- Create a GitHub account.
- Add a payment method. GitHub provides a free tier of 120 core-hours per month, sufficient for this book.
Step 2: Create Your Codespace
- Create a new GitHub repository.
- On the repository's main page, click the
< > Codebutton. - Select the "Codespaces" tab and click "Create codespace on main".

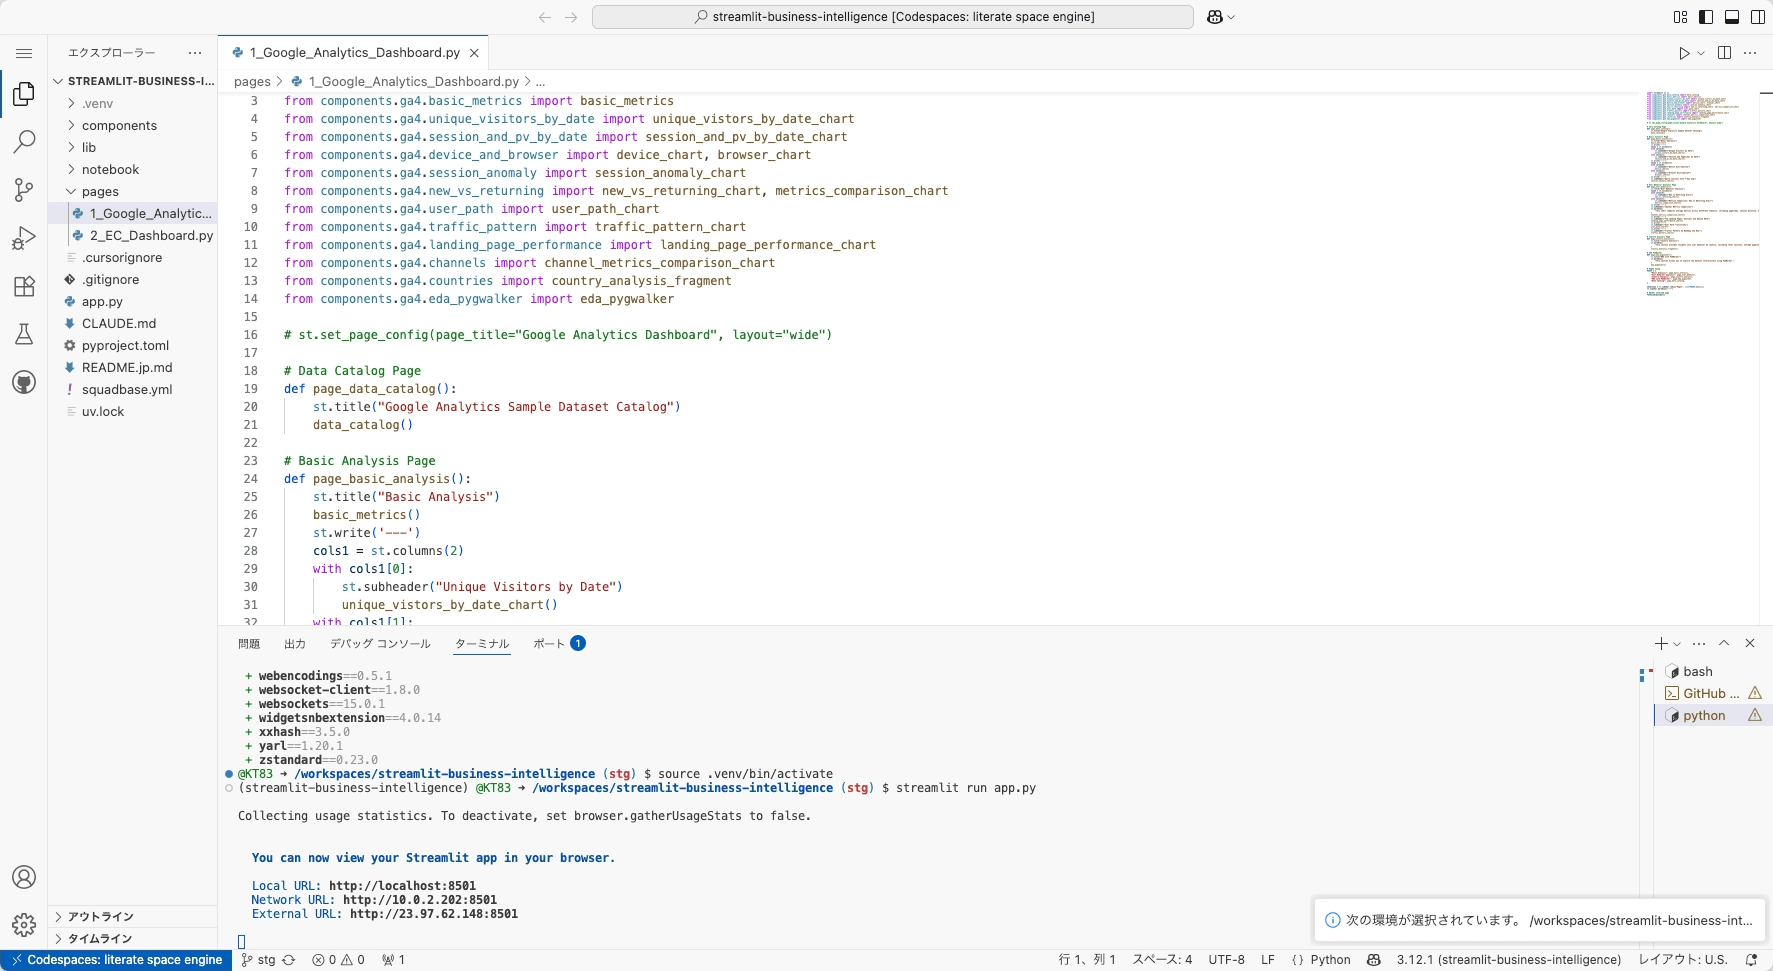
Once the Codespace is built, you will be in a VS Code interface, ready to develop.
Step 3: Automate Your Environment (Optional)
Create a .devcontainer/devcontainer.json file in your repository to automatically configure your environment, install extensions, and run setup commands.
Example configuration for a Streamlit project:
{
  "name": "streamlit-lab",
  "image": "mcr.microsoft.com/devcontainers/python:3.11",
  "postCreateCommand": "pip install -r .devcontainer/requirements.txt",
  "forwardPorts": [8501],
  "customizations": {
    "vscode": {
      "extensions": [
        "ms-python.python",
        "ms-python.vscode-pylance",
        "GitHub.copilot"
      ],
      "settings": {
        "python.defaultInterpreterPath": "/usr/local/bin/python"
      }
    }
  }
}
Create a requirements.txt file in the .devcontainer directory with your Python packages (e.g., streamlit, pandas).
Choosing a Package Manager: uv vs. pip
We recommend uv, a modern, high-performance alternative to pip.
| Feature | uv (Recommended) | pip (Standard) |
|---|---|---|
| Speed | 8-10x faster installation | Slower |
| Ease of Use | Built-in virtual environment management (uv venv) | Requires manual venv commands |
| Dependency Resolution | Advanced and faster | Basic |
Setup with uv
# Install uv
curl -LsSf https://astral.sh/uv/install.sh | sh

# Create a virtual environment and install packages
uv venv
uv pip install streamlit pandas plotly

# Test your installation
streamlit hello
Setup with pip
# Create and activate a virtual environment
python -m venv .venv
source .venv/bin/activate  # macOS/Linux
# .venv\Scripts\activate   # Windows

# Install packages
pip install streamlit pandas plotly

# Test your installation
streamlit hello
If the Streamlit demo app appears in your browser, your environment is ready.
Creating Your First Streamlit App
Create a file named app.py and add the following code:
import streamlit as st
import pandas as pd

st.title('My First Sales Dashboard')

# Create sample data
data = pd.DataFrame({
    'Month': ['Jan', 'Feb', 'Mar', 'Apr', 'May'],
    'Sales': [100, 120, 110, 140, 130]
})

st.dataframe(data)
st.line_chart(data.set_index('Month'))
Run the app from the terminal:
streamlit run app.pyThis creates a functional dashboard with minimal code.
Experiment with AI Code Generation
Use an AI chat tool like ChatGPT or GitHub Copilot Chat to generate a more advanced app.
Prompt:
Create a Streamlit app that allows a user to upload a CSV file. The app should display the data in a table and visualize the numeric columns in a line chart.
Example AI-Generated Code
import streamlit as st
import pandas as pd

st.title("CSV Data Uploader and Visualizer")

uploaded_file = st.file_uploader("Choose a CSV file", type='csv')

if uploaded_file is not None:
    df = pd.read_csv(uploaded_file)
    st.header("Data")
    st.dataframe(df)

    numeric_cols = df.select_dtypes(include='number').columns
    if not numeric_cols.empty:
        st.header("Chart")
        st.line_chart(df[numeric_cols])
Save this code as app.py and run it to see an interactive data application built by AI.
Troubleshooting
- Port in use: Specify a new port with
streamlit run app.py --server.port 8502. - Need more details: Run in debug mode with
streamlit run app.py --logger.level debug.
Chapter Summary & Checklist
This chapter covered setting up a development environment, building a simple dashboard, and using AI to generate a data application.
Before proceeding, ensure you have:
- Launched GitHub Codespaces.
- Successfully run
streamlit hello. - Created and run a custom
app.py. - Generated and run a Streamlit app using an AI assistant.
With these steps completed, you are ready for the next chapter, where we will build a full-scale BI dashboard with real-world data.
Get your first dashboard in 10 minutes
Free to get started · No credit card required
Start talking to your data