7. Implementing Complex Business Logic
In real business situations, many ambiguous requirements arise like "want to analyze somehow" or "want to know more details." This chapter teaches thinking methods and data understanding approaches to transform such requirements into forms achievable through programming.
Converting Requirements into Specific Logic
The foundation of engineering thinking is problem decomposition. Break down complex requirements into small elements that are easy to process programmatically.
For example, suppose there's a requirement to "analyze products with poor sales." To make this processable by a program, we need to consider points like:
- Which period's sales are we referring to? ... Without defining a period, data volume becomes enormous and analysis becomes difficult.
- What are we comparing against to judge "poor"? ... Should we look at products with low sales quantities among all products? Should we look at products with relatively low sales quantities within the same category? Should product price be considered?
By decomposing requirements into small elements this way, we can clarify the data targets and analysis direction to focus on.
Exploring Data Together with Claude Code
Next, we need to quantify judgment criteria. This means converting subjective judgments like "poor sales" into specific conditions like "80% or less compared to the same period last year." Such quantification requires examination while looking at actual data. Exploring data to determine analysis direction this way is called Exploratory Data Analysis (EDA).
Normally, EDA requires dedicated tools or data analysis environments like Jupyter Notebook, but in the Streamlit + Claude Code environment, this can also be achieved by requesting AI.
Generating Analysis Ideas ~ Initial Implementation
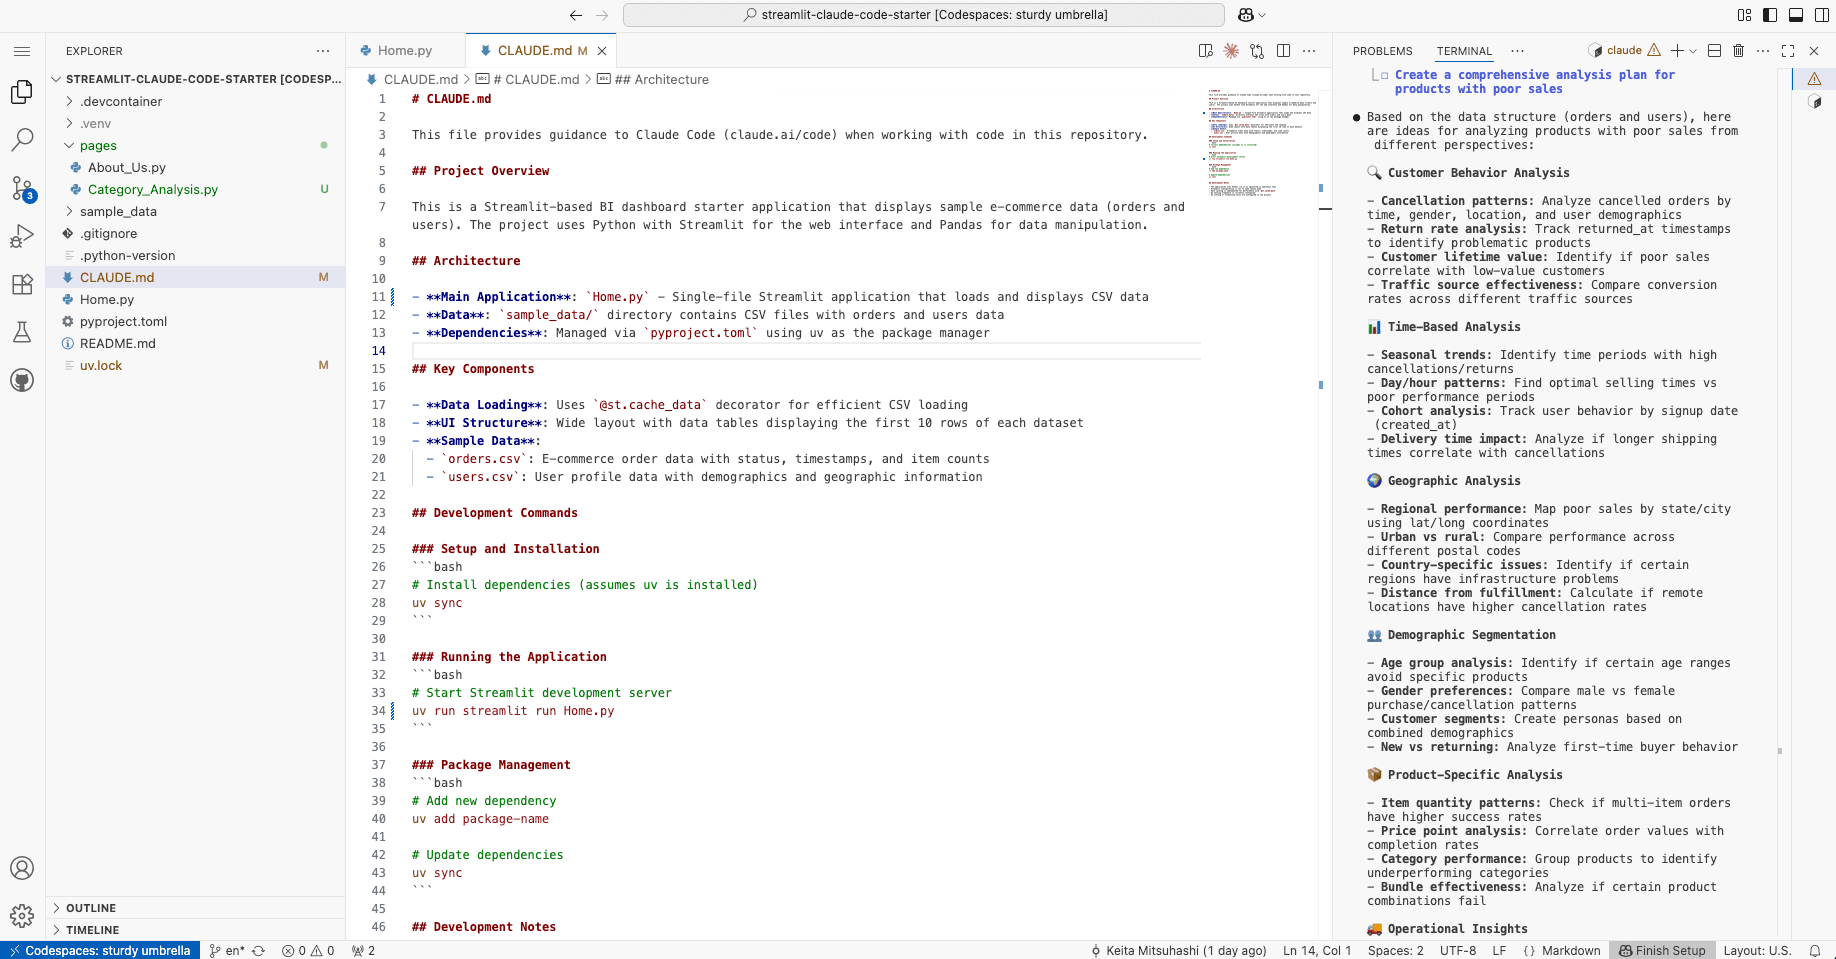
For example, let's request analysis idea generation from Claude Code.
Please give some ideas for analyzing products with poor sales. Give me ideas from different perspectives.
For the dataset description, refer to @README.md file, then load the actual CSV files to accurately understand the data structure before starting work.
This yielded proposals like the following:
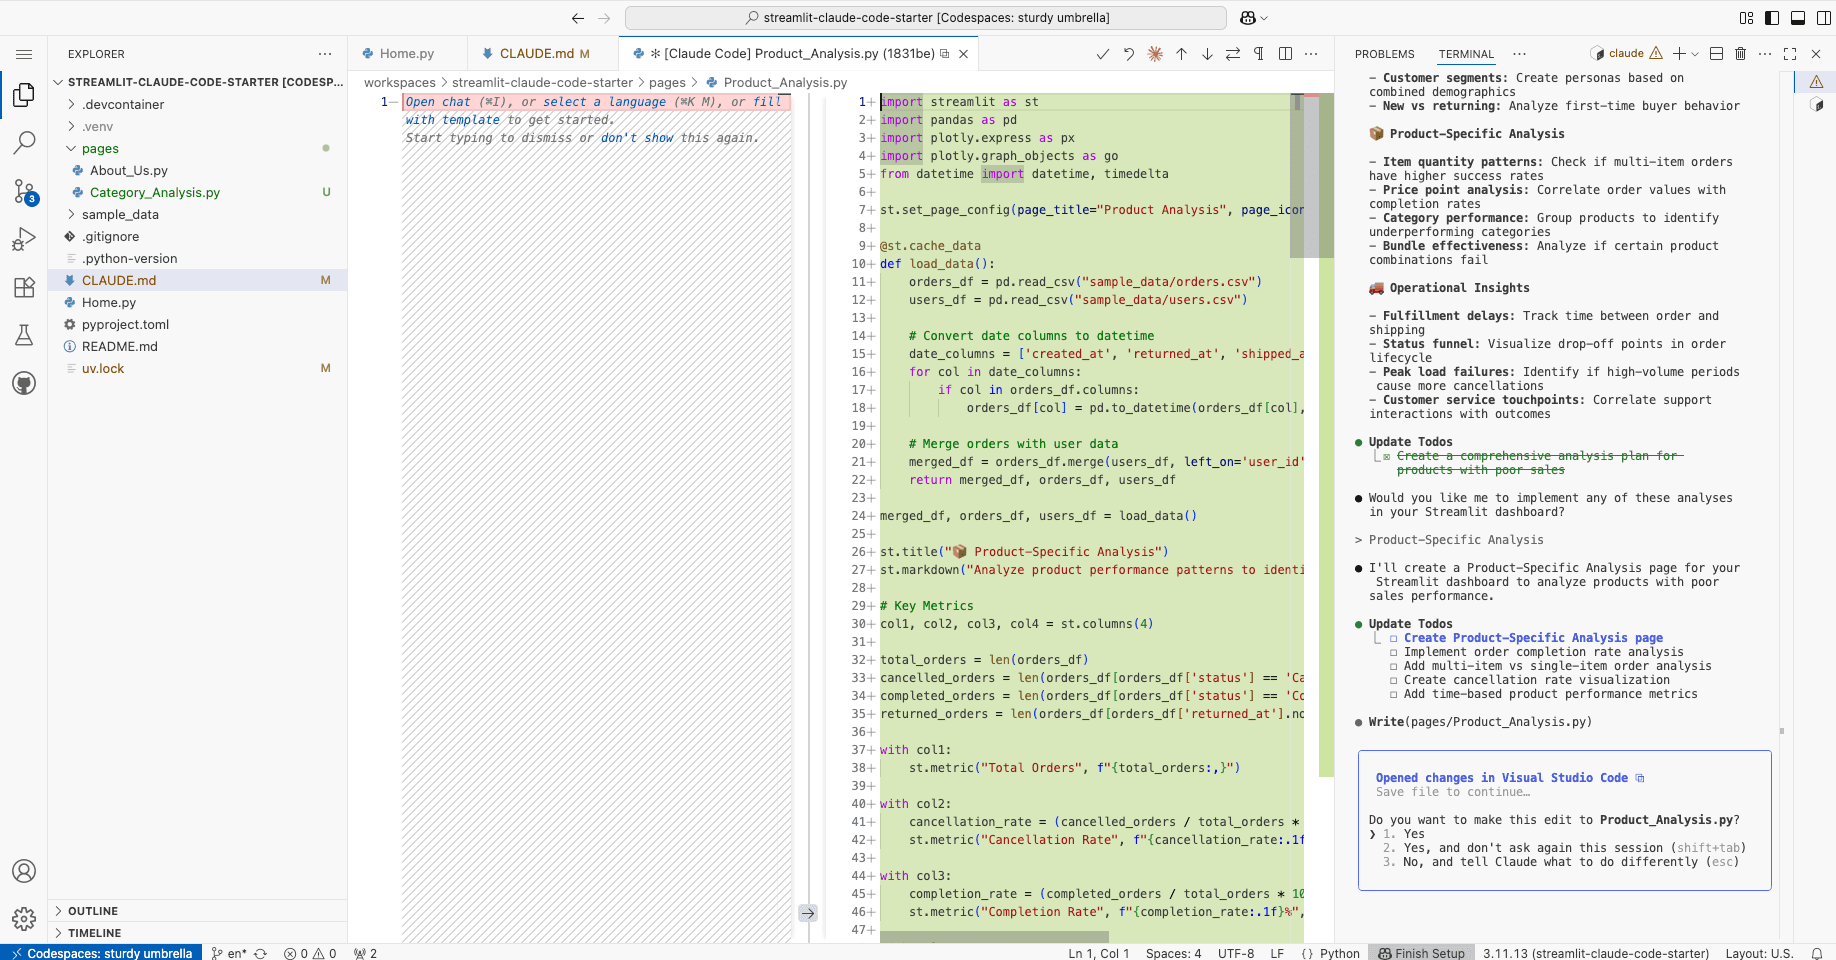
This time, we requested "Product-Specific Analysis"
Since the initially completed page had errors, we sent the error message for correction. After one error fix, a page like this was completed:
Exploring Data
In Claude Code, the range selected in the editor is recognized as context, so you can give instructions for that range.
As an example, let's change the category analysis content to compare top and bottom categories by average sales quantity. First, find the relevant section in the code. Since Claude Code's output code basically includes comments for explanation, use those as reference to search.
Once found, give instructions to Claude Code with the relevant section selected. If the selection range is correctly recognized, there should be an xx lines selected display below the chat input area.
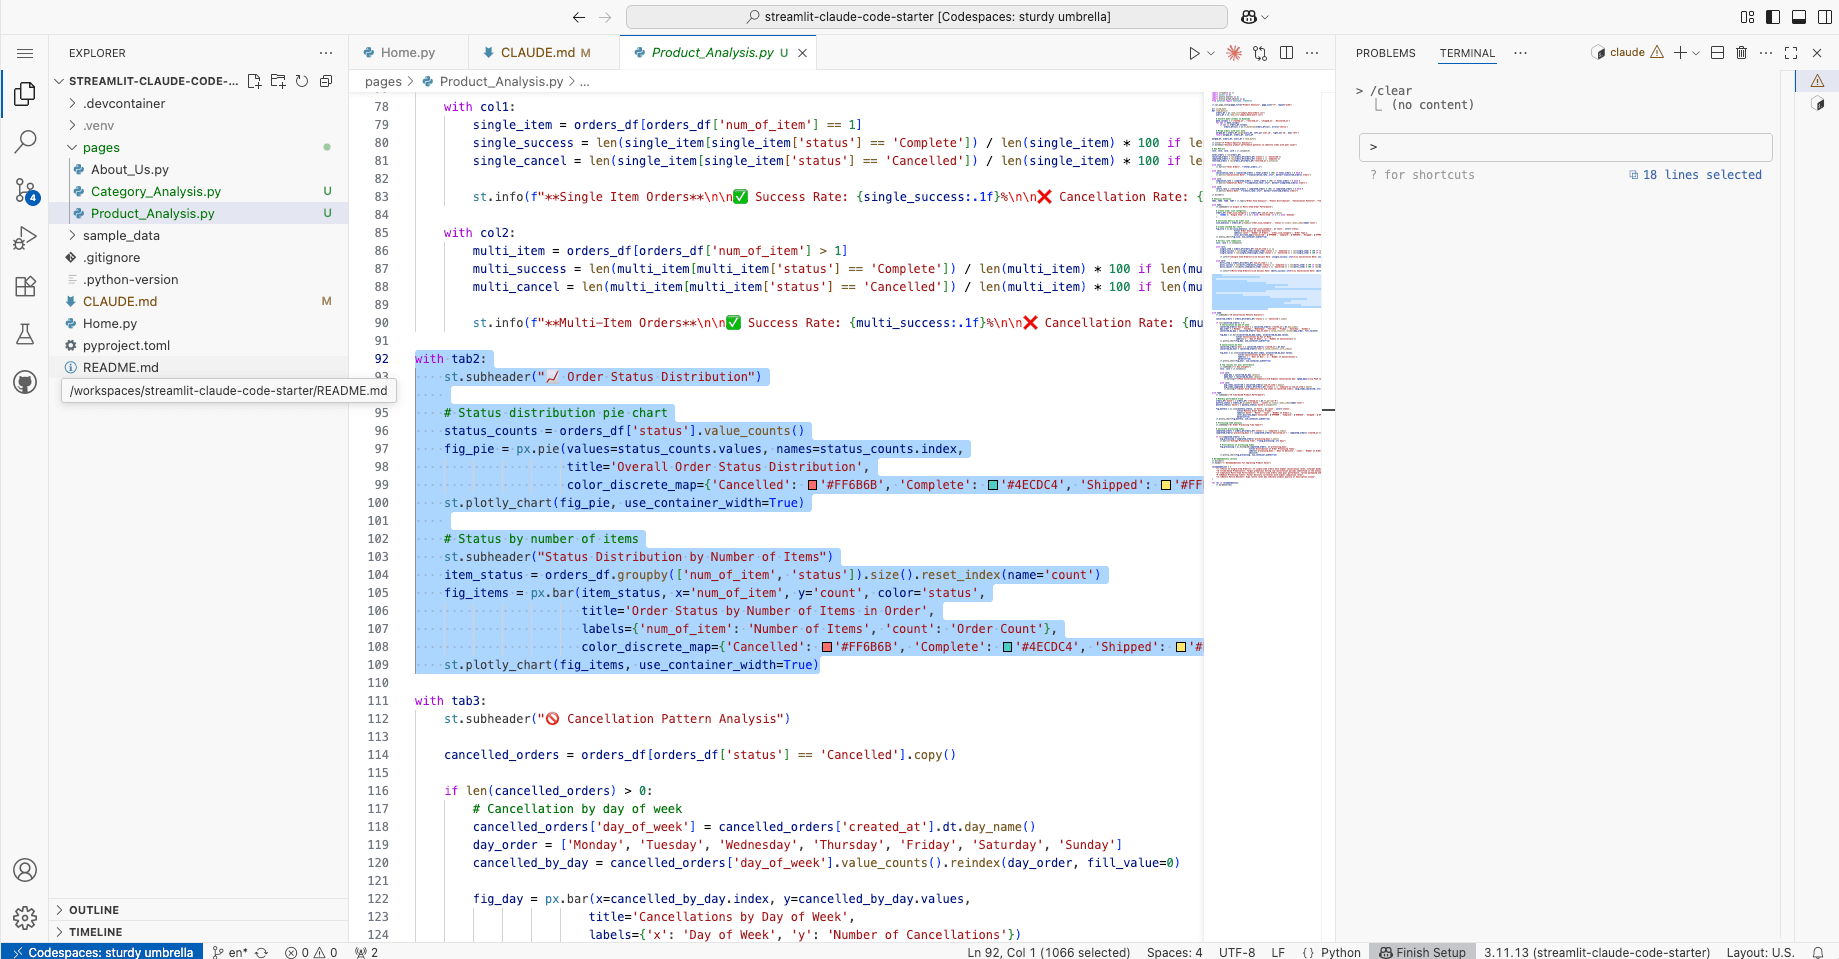
This way, you can explore data together with Claude Code, going back and forth between code and results!
Review
This chapter provided hands-on experience with exploratory data analysis, exploring data analysis direction through dialogue with Claude Code.
By mastering this technique, you can now express questions and requirements arising in actual business as code-based BI. Once you can do this much, you can be said to have become capable of building practical dashboards. Next, let's finally learn how to share completed dashboards with your team.
Get your first dashboard in 10 minutes
Free to get started · No credit card required
Start talking to your data