6. Adding Rich User Interactions
This chapter teaches how to add data filtering and interactive visualization using Streamlit widgets so users can freely explore data during usage.
By utilizing Streamlit's rich widgets, you can easily implement rich UI for user operations. Check the documentation to see what widgets are available.
https://docs.streamlit.io/library/api-reference/widgets
Let's get started right away!
Creating a New Analysis Page
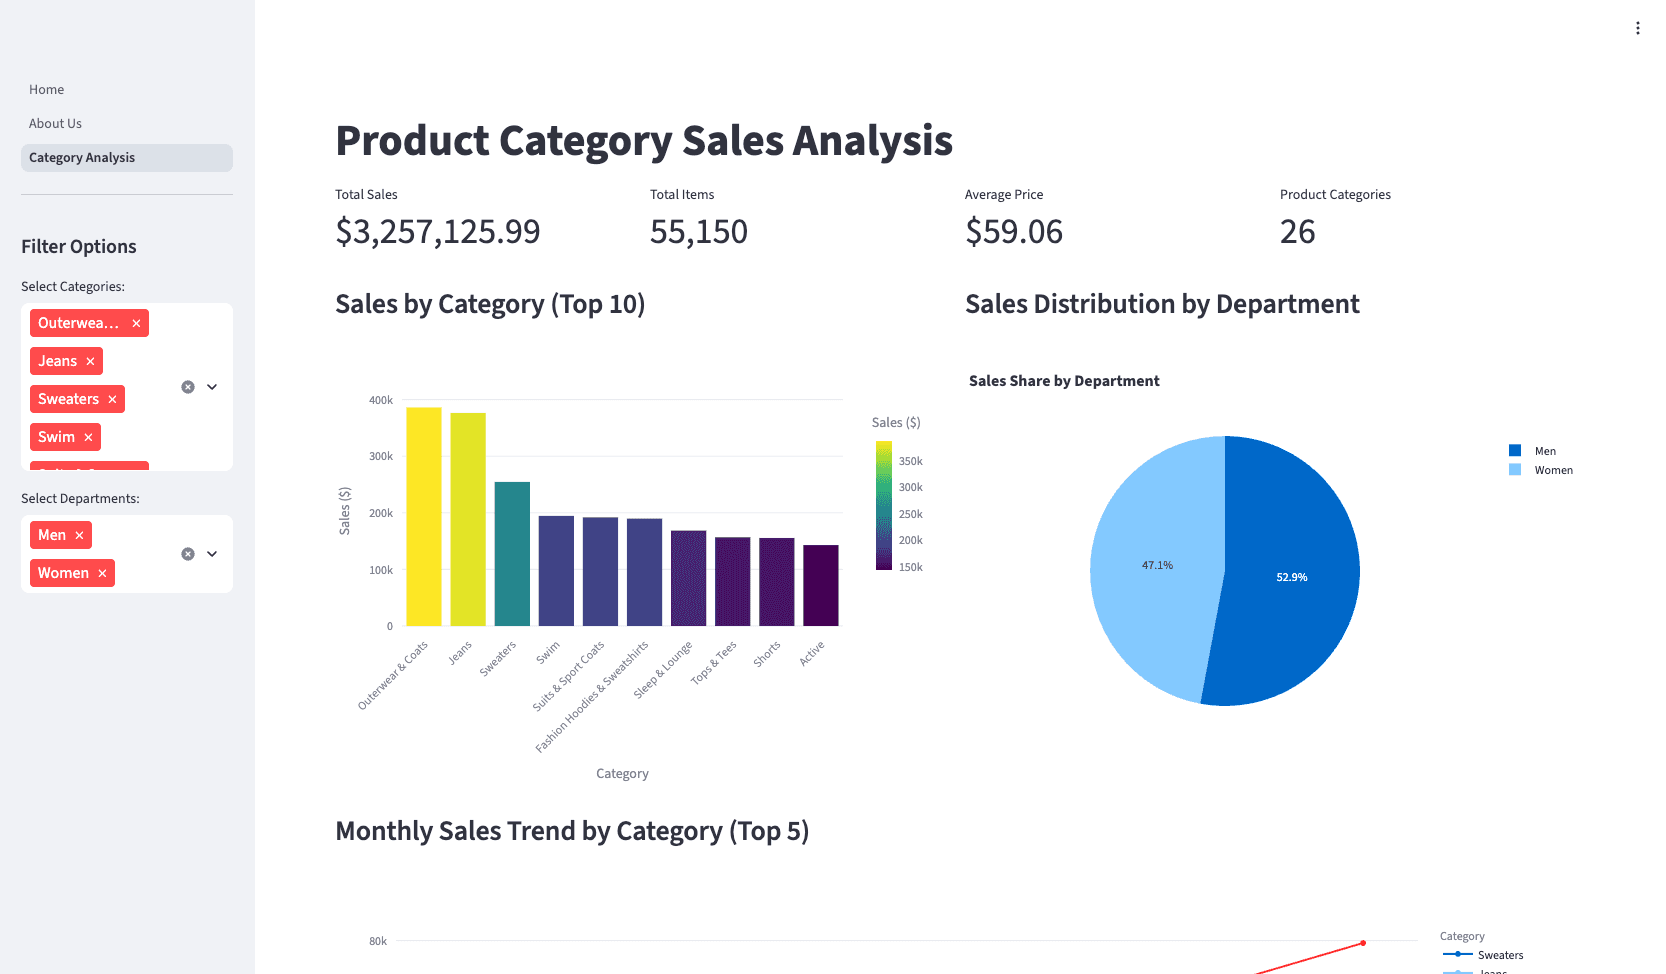
First, let's create a new sales analysis page by product category. Try requesting from Claude Code as follows:
Create @pages/Category_Analysis.py file and create a sales analysis page by product category.
For the dataset description, refer to @README.md file, then load the actual CSV files to accurately understand the data structure before starting work.
Once Claude Code's work is complete, open a new terminal and execute streamlit run Home.py to check operation. Category Analysis should be added to the sidebar.
Was a page like this created?
Data Filtering and Interactive Visualization
Now let's add interactive elements to implement data filtering.
Try requesting from Claude Code as follows:
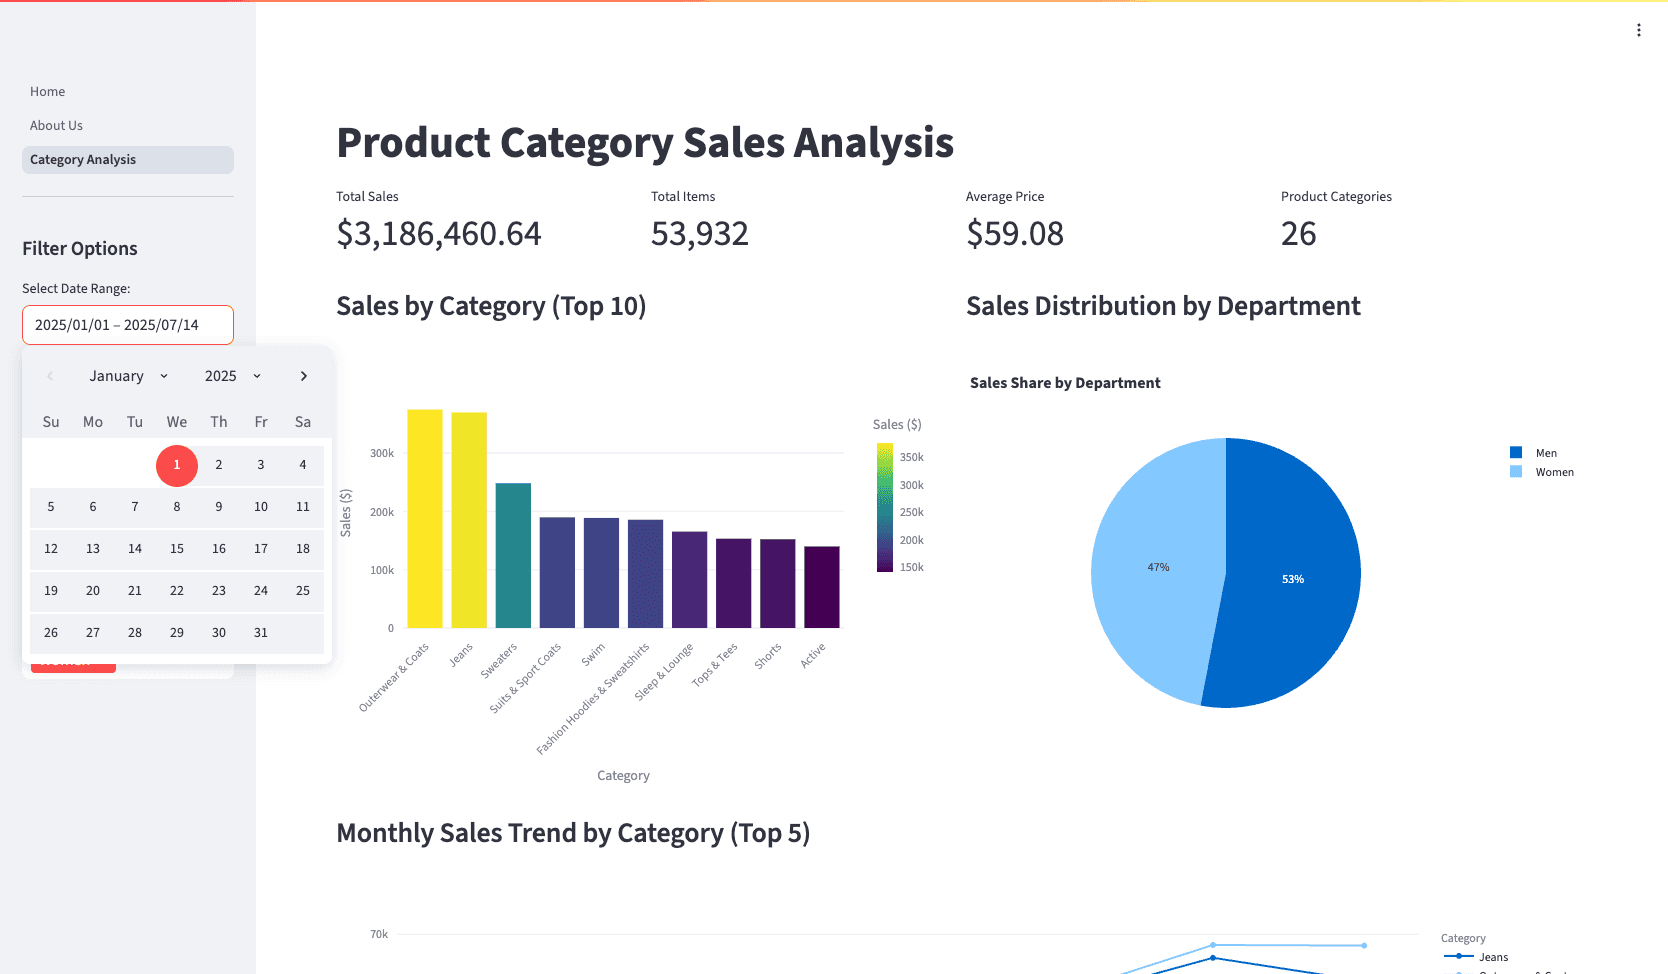
Modify @pages/Category_Analysis.py file and add widgets to specify the analysis target period.Has a date selection field been added like below? If implementation went well, try actually selecting dates to confirm that interactive analysis is possible.
If errors occur during execution, copy the error message and report it to Claude Code.
Specifying UI Elements You Want to Use
If there are specific UI elements you want to use among Streamlit widgets, include them in your instructions. For example, let's change category filtering to st.radio.
Modify @pages/Category_Analysis.py file and change gender filtering to `st.radio`.Review
This way, logic and UI customizations that were difficult to implement in traditional BI can be completed just by requesting from Claude Code!
Your instructions to Claude Code have also improved, and you should now be able to effectively communicate specific and achievable requirements. In particular, you've learned that using the @ prefix allows you to clearly manage the context given to Claude Code.
As an advanced exercise, consider usage scenarios with actual business data. For example...
- Multi-axis analysis of sales data
- Comparative analysis of customer segments
- Inventory level monitoring and prediction
- Marketing ROI measurement
To implement more complex and specific requirements, you'll need multiple exchanges with Claude Code. When doing so, apply what you learned this time and be mindful of instruction specificity and context management.
The next chapter challenges more complex business logic implementation. Based on the skills you've learned so far, let's build full-scale business applications that can handle complex real-world requirements.
Get your first dashboard in 10 minutes
Free to get started · No credit card required
Start talking to your data