Implementing Advanced Interactive Features
Let's evolve your dashboard from a simple data display tool into an interactive analysis tool that users can engage with.
The dashboard we created in the previous chapter was beautiful and functional, but could only "view" data. In this chapter, we'll add features like filtering, drill-down, and real-time updates to achieve flexibility beyond self-service BI tools.
Creating a New Analysis Page
First, let's create a new sales analysis page by product category. Before that, let's clean up the conversation history. Enter the following command in Claude Code:
/clearNow, let's request Claude Code as follows:
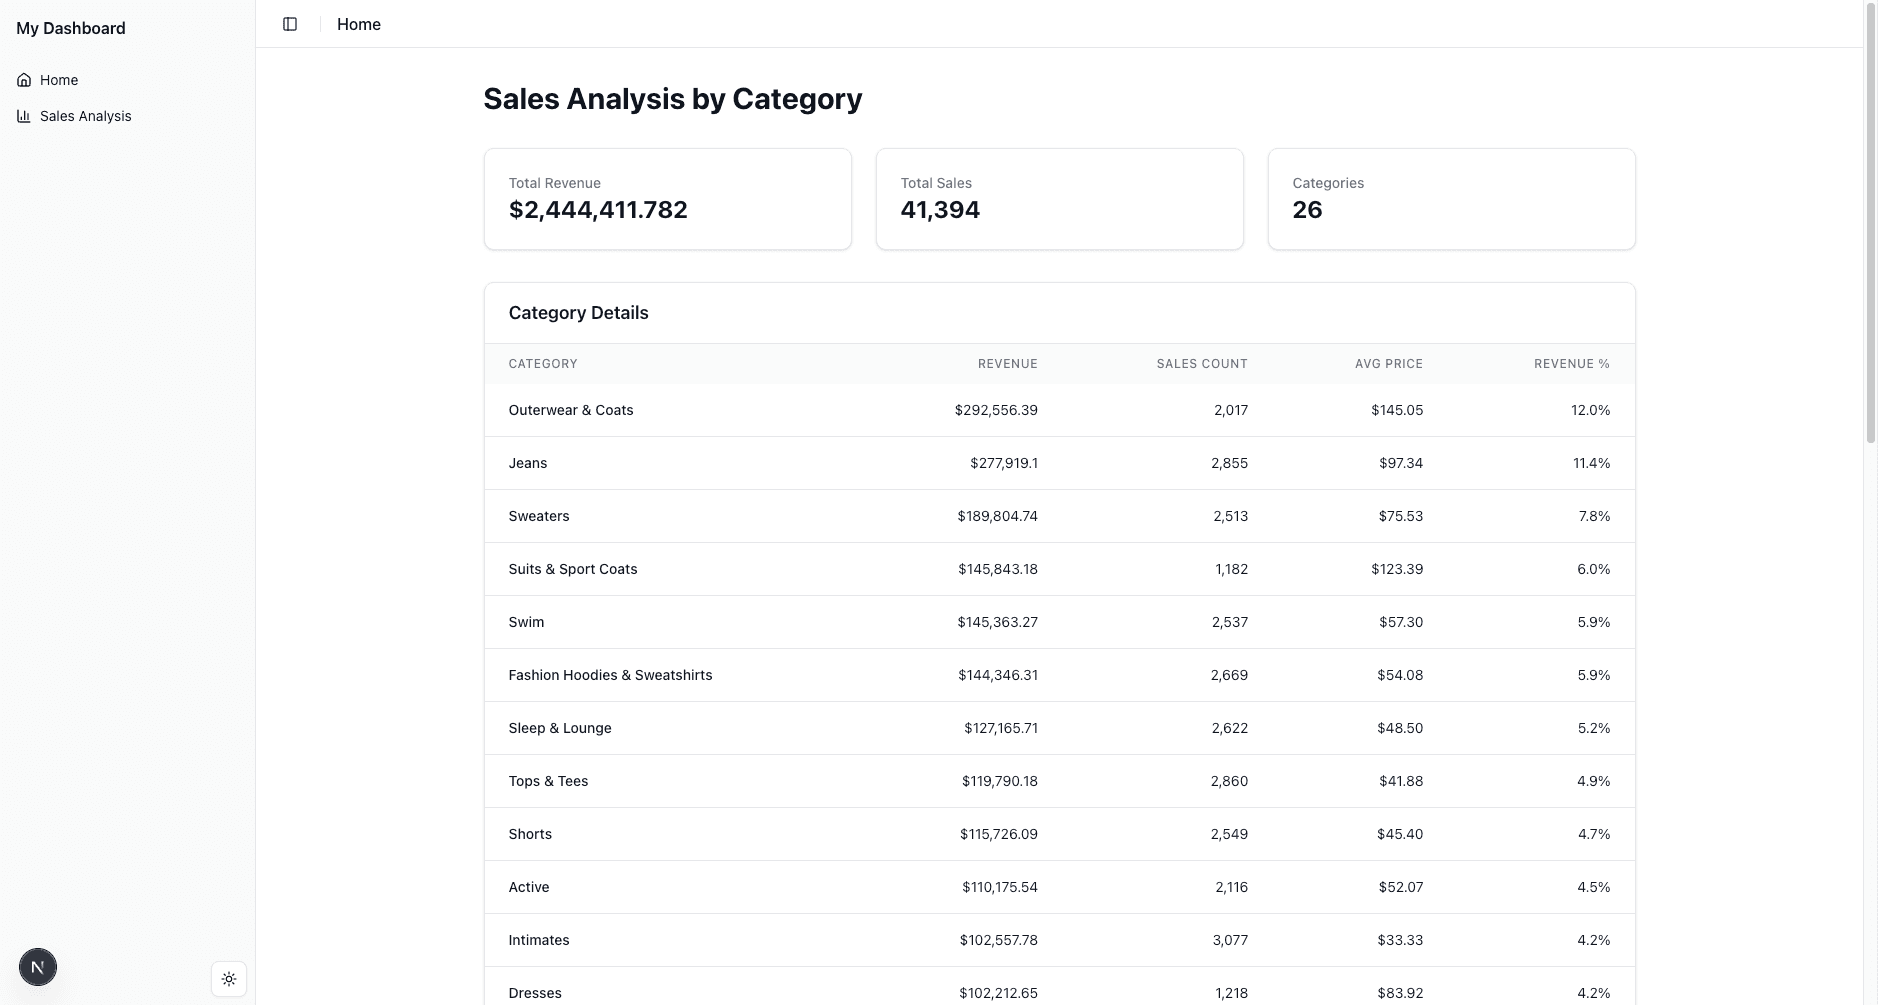
Please create a new sales analysis page by product category.
Use the CSV files in the public/sample_data directory for data.
After implementing the page, please also add a link in the sidebar.
If you encounter errors during development, copy and paste the error message and report it to Claude Code. It will propose and implement solutions.
Has a page like this been created? While your screen implementation might differ, it's fine if a sales analysis page using sample data has been created.
Data Filtering and Interactive Visualization
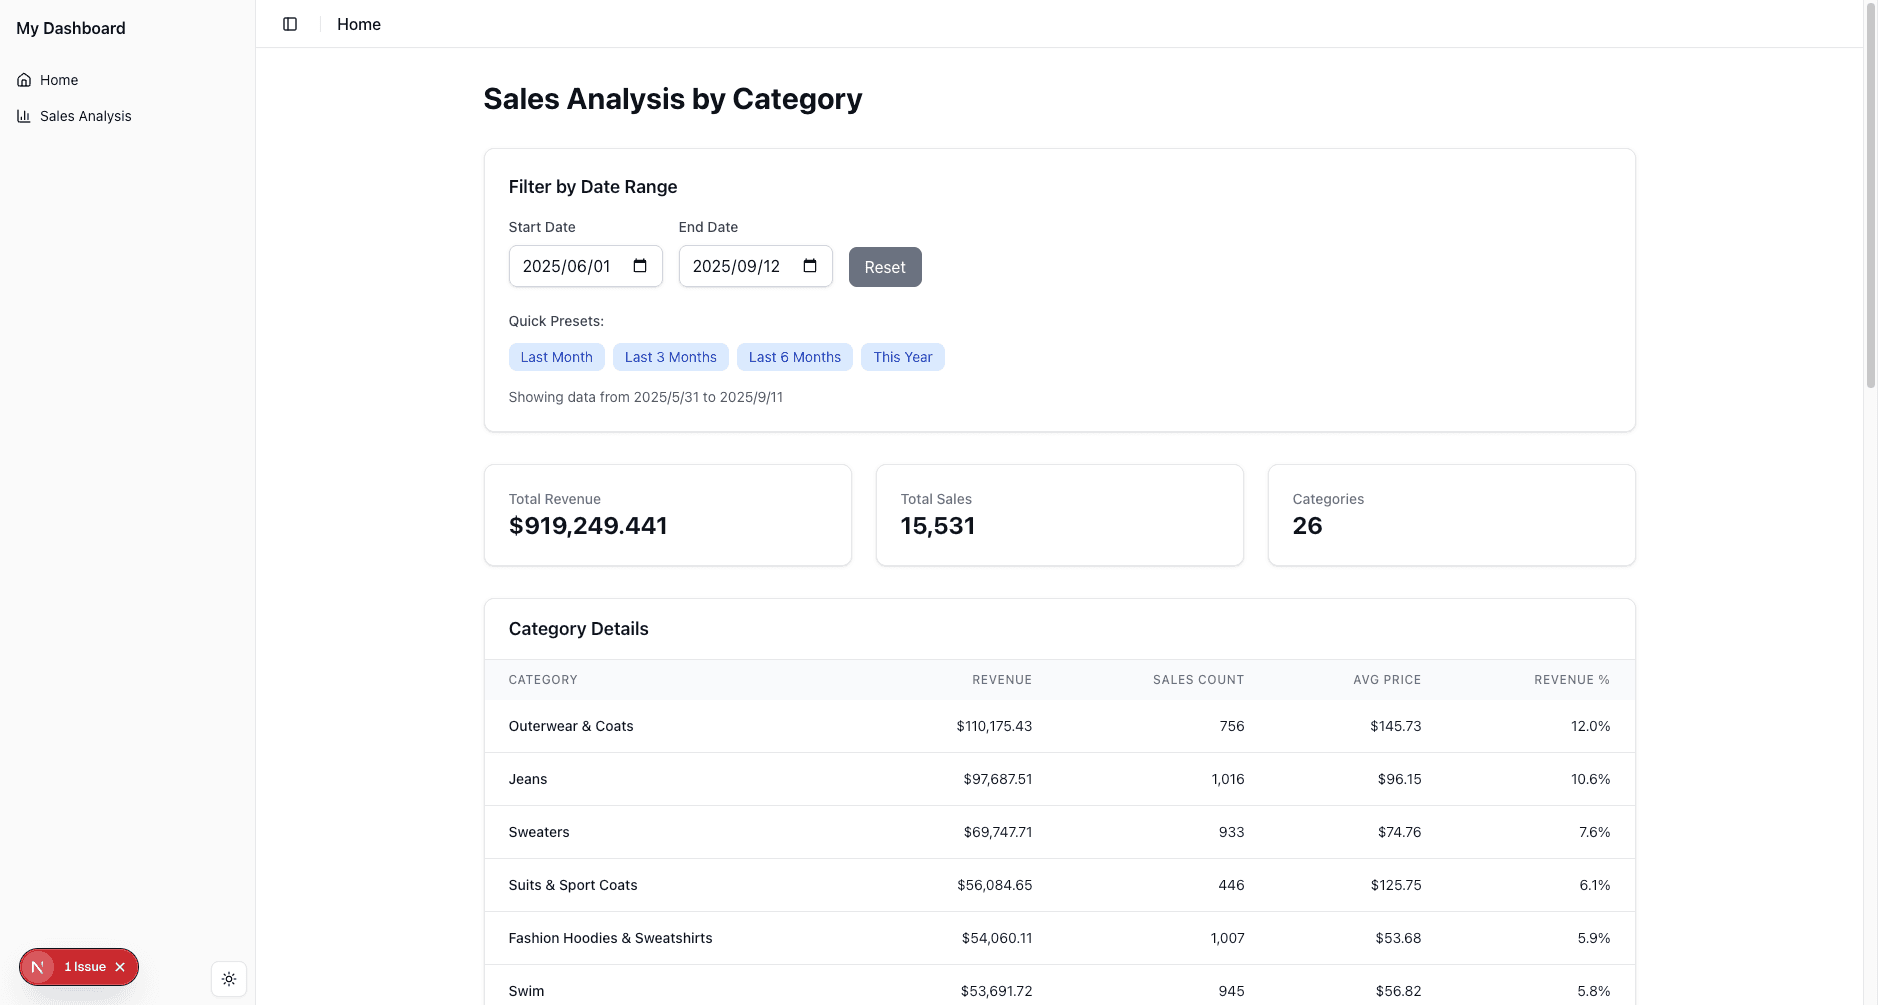
Now, let's add interactive elements to implement data filtering.
Please add a UI to specify the analysis period and make the data display respond to filtering conditions.Has a date selection field been added like this? If the implementation is working well, try selecting dates to confirm that interactive analysis is possible.
If you get runtime errors, copy and paste the error message and report it to Claude Code.
Specifying UI Elements to Use
The Squadbase Next.js template has shadcn/ui components pre-added. You can check what components are available on the shadcn/ui official website.
Review
As you can see, logic and UI customization that was difficult to implement in traditional BI can be completed just by requesting it from Claude Code!
Your instructions to Claude Code have also improved, and you should now be able to effectively communicate specific and achievable requirements. In particular, you've learned that using the @ prefix allows you to clearly manage the context you give to Claude Code.
As an advanced exercise, consider application scenarios with actual business data. For example...
- Multi-axis analysis of sales data
- Comparative analysis of customer segments
- Inventory level monitoring and forecasting
- Marketing ROI measurement
To implement more complex and specific requirements, you'll likely need multiple exchanges with Claude Code. Even then, apply what you learned this time by being mindful of instruction specificity and context management.
In the next chapter, we'll learn how to connect to databases.
Get your first dashboard in 10 minutes
Free to get started · No credit card required
Start talking to your data