Data Preparation and Basic Dashboard Construction
In this chapter, we'll actually implement a dashboard using Claude Code. The forked repository contains sample CSV files, which we'll use to give specific instructions to Claude Code.
The sample data CSV files are located in the public/sample_data directory.
Establishing Analysis Strategy from Data Content
As the first step, we'll have Claude Code establish an analysis strategy from these files. Give Claude Code instructions like this:
I want to add analysis functionality to @app/page.tsx. Please read the data from @public/sample_data/users.csv and @public/sample_data/orders.csv and establish an analysis strategy.Claude Code will understand the data structure and propose analysis ideas like the following (the actual response might differ slightly from this example):
Recommended Analysis Features

  1. Basic KPI Dashboard
    - Total users, total orders
    - Distribution by order status (Cancelled, Completed, etc.)
    - Average order item count
  2. Time Series Analysis
    - New user registration trends
    - Time series changes in order count
    - Monthly/weekly trends
  3. Geographic Analysis
    - User distribution map by state
    - Regional order performance
  4. User Behavior Analysis
    - User acquisition by traffic source
    - Order trends by age and gender
    - User segment analysis
  5. Interactive Filtering
    - Period filter
    - Regional filter
    - User attribute filter

● Implementation Approach:
  - Utility functions to load CSV data
  - Visualization with Chart.js or Recharts
  - Server-side data processing, client-side display
  - Gradual feature addition (Basic KPI → Time series → Geographic analysis)

  Which analysis feature would you like to start with?
If Claude Code's proposal doesn't align with what you want to implement, communicate with it at this point to adjust the direction.
Once you find something you want implemented, tell Claude Code and proceed with implementation.
Verifying the Created Code's Operation
Claude Code will frequently ask for permission to edit files. Choose whether to give permission each time or grant permission all at once to proceed.
When development is complete, it may ask for permission to start the development server, so give it permission. Once the development server starts, Cmd (Ctrl on Windows) + click the URL in the terminal to check the application. Is a new component added to the screen like this?
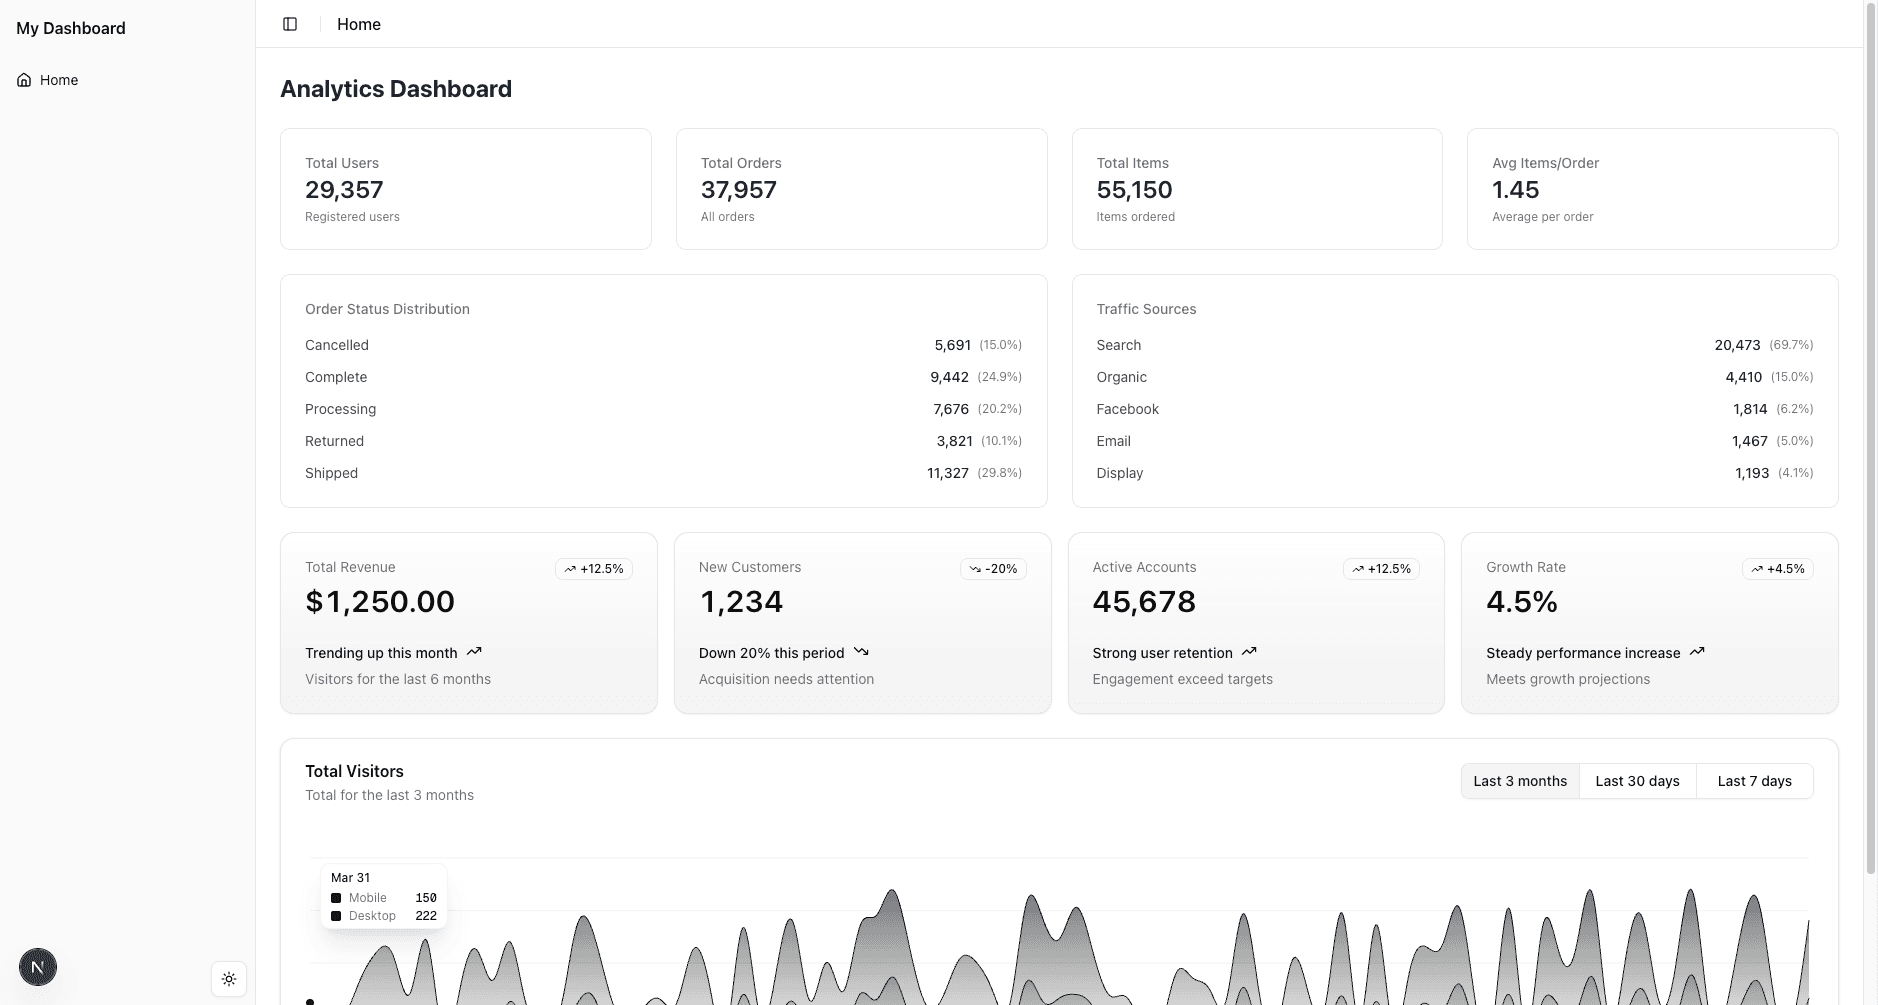
Looks good! This implements the basic dashboard functionality.
The mock data components included in the template are no longer needed, so let's remove them.
@app/page.tsx Please remove the mock data components from this file.Code and Library Explanations
Let's explain the code and libraries used in this chapter.
Next.js File Structure
The template we used employs Next.js's App Router mode. In this mode, the file structure is as follows:
app/- Page files and layout files. Place files that become pages in this folder.components/- Reusable UI components. Place reusable UI components in this folder.lib/- Utility functions and configuration. Place utility functions and configuration in this folder.public/- Static files. Place static files (like images) other than program files in this folder.
shadcn/ui Components
The template we used has shadcn/ui components pre-added. Using shadcn/ui allows you to achieve modern and simple UIs. Since Claude Code actively uses components prepared in the codebase, adding them beforehand stabilizes the output.
Review
In this chapter, we implemented a dashboard using Claude Code. In the next chapter, let's try implementing slightly more complex interactions.
Get your first dashboard in 10 minutes
Free to get started · No credit card required
Start talking to your data