Event report: Squadbase Community Meetup #0

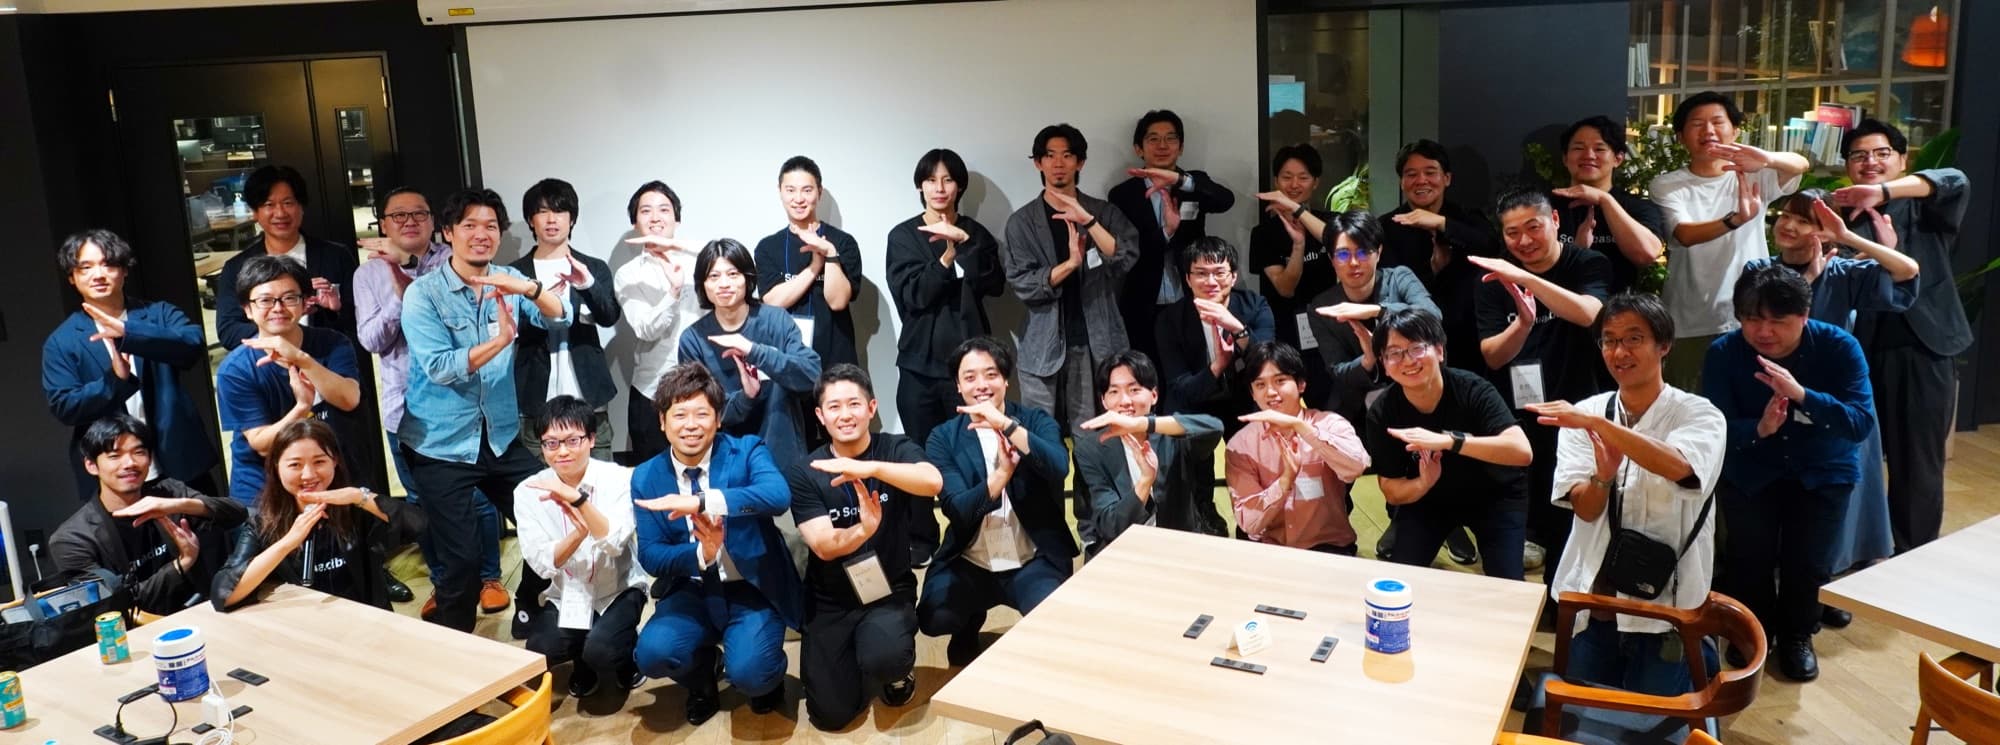
On September 30, 2026, we held "Squadbase Community Meetup #0", our user community meetup, at the NTT DATA Shin-Tokyo Building in Marunouchi, Tokyo. It was our first community event, held to celebrate the launch of Public Beta. About 30 people joined us, and the room was full of energy.
This report covers the four sessions of the day along with the slides from each talk. At the end, we also share what's next for the community, including Meetup #1 in November and a new working group. We hope you'll read to the end.
Launching a community of "people who use data to make their work better"
In the opening, our host Nagahashi introduced the launch of the Squadbase user community. The concept is "a community of people who use data to make their work better." You don't need to be a data analysis specialist to use AI to find meaning in data and turn it into decisions and actions. We want this to be a place where practitioners like that bring their cases and know-how, and spread a way of working where using data is simply the norm.
The community has three goals:
- Share: users share use cases, examples, and knowledge with each other
- Deliver: insights and feedback from the field go directly to the product team and shape development
- Spread: real voices from practitioners reach more people and widen the circle of data use
There's a reason we called this "#0" instead of "#1". Before the official launch, we wanted to start building the community together with the people who have been using Squadbase since the early days.
Toward Data Autopilot: removing the work of "going to look", so data speaks first
Product & demo session
"Squadbase's product vision and roadmap"
Naoto Shibata, Co-founder & CEO, Squadbase
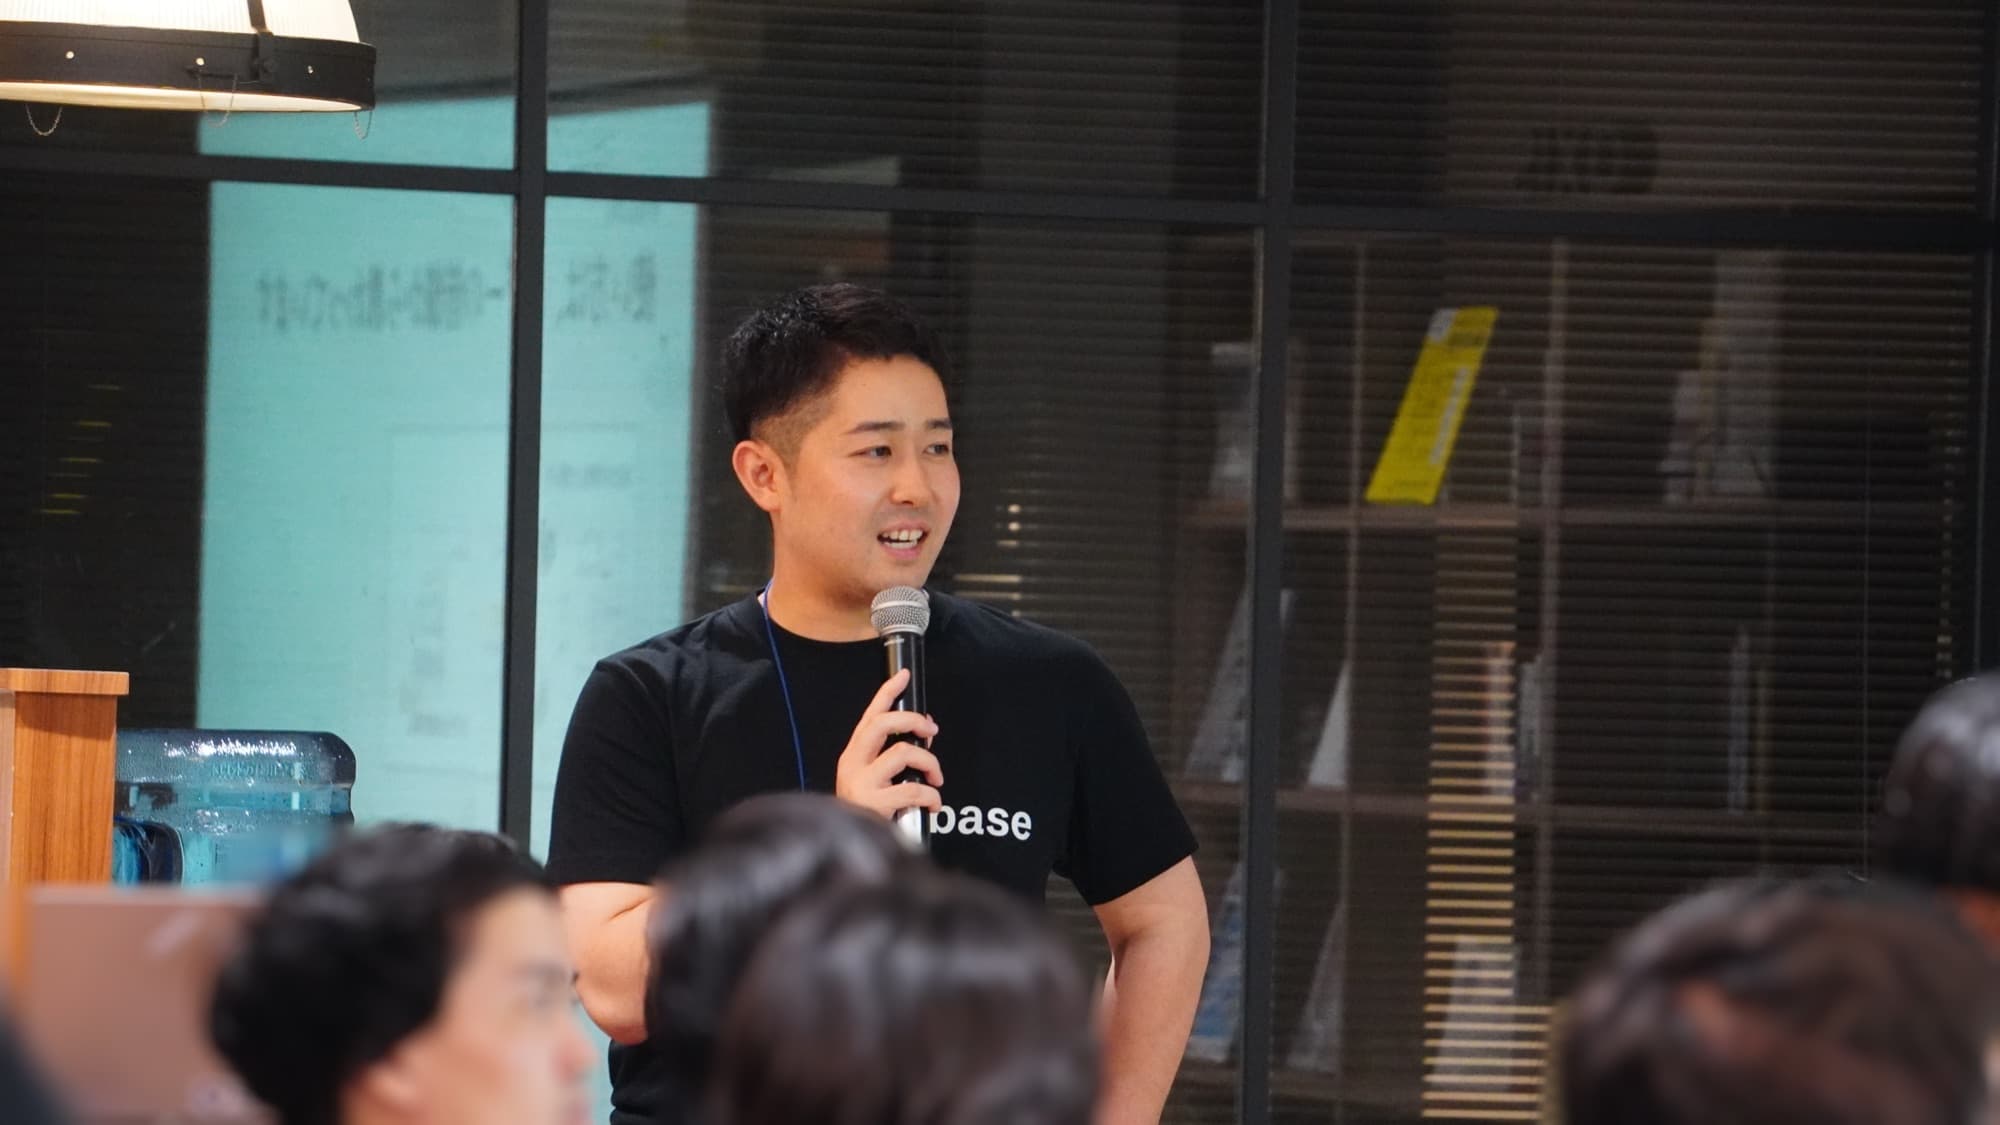
In the first session, our CEO Shibata presented "Data Autopilot", the direction Squadbase is heading in, and the roadmap to get there.
Data autopilot has "levels" too
Self-driving cars have defined levels that describe how much you can leave to the car. At Squadbase, we apply the same idea to data work and use it as the team's goal.
- Lv0 Ask and wait: before AI. You ask someone who can handle data, and wait for the result
- Lv1 SQL disappears: with generative AI, you no longer write SQL yourself
- Lv2 Building disappears: ask AI and a dashboard appears; people check the result
- Lv3 Going to look disappears (now): when data changes, AI sends you a notice
- Lv4 Looking disappears (next): without looking at data, AI suggests what to discuss and what to do next
Squadbase is now at the stage of refining Lv3. Squadbase is also designed to be used by "a team that shares the same KPI" (a Squad). Not an individual, not the whole company, but a unit like a marketing team that tracks a pipeline. That way, the context of "what to do when which number moves" can be handed to AI in high resolution.
Like Slack, Notion, or Figma, it starts with a small team and spreads sideways. Squadbase works exactly that way. It's a tool for a team to track one KPI together, notice changes in the data, and deliver results as a group.
69 updates in three months
From July to September, Squadbase shipped 69 updates. The session looked back at the main ones.
- Public Beta (August 31): anyone can now start on the free plan
- Built-in LLM: add AI features such as summaries and chat to dashboards, without an API key
- Templates: roll out a project you built to other teams as-is
- Custom connectors: partner companies can publish their services as connectors
On top of that, in the week of September 28, when the event took place, we released a batch of new features.
- Automation: run data ingestion, aggregation, analysis by AI agents, and notifications to Slack or Teams automatically
- Data output: beyond dashboards, create slides, spreadsheets, and documents, and download them locally
- Connection swapping: swap a template's connection for your own data
- Public datasets: share a Squadbase DB read-only, without copying it
We kept hearing about people building a dashboard, taking a picture of it, and pasting it into PowerPoint. So we thought, if we could output in that format in the first place, the data work could be finished right there.
At GA, we're going after "looking" itself
Squadbase plans to release the general availability (GA) version at the end of October, aiming for Lv4. Thanks to AI, dashboards can now be built far faster than before. But even if you build 30, you open only 2 or 3 every morning. "Building got faster, but looking is the same as it always was." Noticing changes is still left as human work, and that has become the bottleneck.
That's why we're developing a new UX called "Data speaks first". When something changes, AI sends you a notice, and you simply choose the suggested next step. A dashboard or slides come out as the result. Even after handing work to AI, you can trace the flow from the original tables to the output and check the evidence. We also showed a demo video of this at the venue.
At the end of the session, we introduced our plan for a working group to build the product together with a small group of users.
Things like "we don't need that feature" or "that feature is really great", we want to build the product while talking about exactly that with the development team.
"I built a dashboard with generative AI": is that really true?
Case study session 1: "Someone who has built BI dashboards as a hobby for years tries Squadbase"
Hakuhodo DY ONE Inc. Head of the Knowledge Management Department and Head of the Third Development Department, TX Solutions Division / BI Solutions Development Department, Hakuhodo Technologies Inc.: Ryo Hiromoto

Hiromoto has been building BI dashboards for nearly ten years, since joining the company's dedicated BI department in 2017. Hiromoto earned "Data Saber", Tableau's community certification, in 2019, and has kept launching internal communities and writing blog posts. After coming across Squadbase in 2026, Hiromoto now works on feature validation, internal adoption, and supporting delivery to clients.
The pitfalls of dashboards built with generative AI
These days, you can hand data to generative AI, ask in a single line, and get a good-looking dashboard. People have started to say, "Isn't this good enough for dashboards now?" Hiromoto points out that there's a pitfall there.
For example, data that isn't connected to a database still has problems with updates and security. If you leave metric definitions to AI, standards won't line up across the organization. Even if it looks polished, you can't explain "why this chart" or "what action to take after looking at the data." And if you share it as an HTML file, the dashboard risks leaking outside the company.
With that in mind, Hiromoto describes Squadbase's value as combining "the usability, functionality, and governance of a SaaS product" with "the flexibility and creativity of AI." It has the basics you'd expect from SaaS: connections through data connectors, change history management and GitHub integration, and user management. On top of that, it's flexible enough to leave data definitions, design, and fixes to AI. That is Hiromoto's assessment.
Inside the company, Hiromoto often introduces Squadbase as "next-generation Agentic BI." The honest view, Hiromoto says, is a little different.
Honestly, I see Squadbase as "an AI analytics app that can also build dashboards." Rather than an extension of dashboards, it feels more accurate to say there's a dashboard feature on top of an AI platform.
Handy uses "beyond dashboards"
In the second half, Hiromoto introduced three ways of actually using Squadbase other than building dashboards.
- Creating manual pages: dashboard users tend to get stuck on how to operate them and on data definitions. So Hiromoto creates pages that explain how to use them and the data definitions behind them, just by asking in chat. This is expected to greatly reduce the time spent on answering questions and making documentation
- A way to load and fix data: for data that is still maintained by hand, such as master data, Hiromoto built a screen to upload CSVs and a screen to edit tables directly, and writes the changes back to Squadbase DB
- A summary-writing AI agent: for a dashboard that summarizes traffic to the tech blog, a summary and ideas for "topics worth writing next" are updated automatically and emailed every week
The talk ended with an introduction to "Tech Waves", Hakuhodo DY ONE's official tech blog (Japanese). It publishes validation results for a range of solutions, including Squadbase.
Leaving gut-feel buying behind: dead stock rate down from 7.3% to 3.0%
Case study session 2: "Breaking free from gut-feel buying: how visualizing lead times and dead stock changed a luxury resale business"
Shingo Kuroyanagi, Head of E-Commerce Strategy, LUCA Inc.

Kuroyanagi worked in corporate sales at an automaker and at Recruit, and at a startup handled everything from opening sales channels to selling the business. Kuroyanagi is neither an engineer nor someone who has worked with AI for long. This is the story of how Kuroyanagi changed the criteria for management decisions with Squadbase.
With one-of-a-kind stock, you can't see "days until it sells"
LUCA buys luxury brand items such as Moncler and Balenciaga at business-to-business auctions in Japan, and sells them on Mercari Shops and eBay. Every item is one of a kind, and each differs in when it was bought, what it is, and its size.
To list items efficiently, the company used a bulk listing tool called "WASABI." But it couldn't tell how many days an item took to sell, or how much dead stock it had. As a result, how much cash was tied up in inventory was a black box, and buying had to rely on gut feel.
Two dashboards built in two hours
Using CSVs exported from WASABI, Kuroyanagi built two dashboards in just two hours.
- Dead stock: from the product CSV, pull out items that haven't sold for 365 days or more since they were registered in WASABI, and calculate the dead stock rate by both item count and value
- Order lead time: aggregate the number of days from registration to first order, by brand, by marketplace, and by category
Based on these, Kuroyanagi built a workflow: "identify dead stock → list it in bulk at business-to-business auctions and turn it into cash → put the recovered cash into buying items that sell quickly."
Inventory is an asset, so I think of it like stocks. You cut your losses early on what doesn't sell and turn it into cash, then invest that money in what sells, meaning the items with short lead times.
Noticing stock that sat for "over a year", and selling it first
At first, they treated anything 180 days or more past registration as dead stock. But it turned out that much of it had been sitting unsold for 365 days or more, so they started selling from there.
The lead time dashboard made it clear "which items from which brands sell in how many days." For example, in the analysis at the time, the median order lead time overall was 30 days. Looking only at shirts sold in May, they sold in 11 days. (These two values cover different sets of items, so they are not a before-and-after comparison.) Now the team discusses what to buy while looking at results by season and category.
Dead stock rate down from 7.3% to 3.0%
As a result, the rate of dead stock sitting for 365 days or more (by item count) fell from 7.3% at the end of June to 3.0% at the end of September. Kuroyanagi says not all of this is the effect of the dashboards, but looks back that "the big thing was that our decision criteria changed."
The next goal is to widen the scope to stock older than 180 days and act earlier. Right now, the team loads a CSV once a month to update the data. Going forward, the aim is to connect directly with a connector and reach a state where "you just look at the notice and decide."
LUCA's work is also covered in detail in our case study, "Breaking free from gut-feel buying."
Turning dashboards into an "exit for data" that connects to real work
Venue sponsor session: "Toward an era where teams rebuild their own dashboards"
Shotaro Motomura, Head of the Data Driven Division, Digital Experience Business Unit, Telecom & Utility Sector / Executive IT Architect, NTT DATA, Inc.

The last session was by Motomura of NTT DATA, which provided the venue. Motomura is an engineer who has built data platforms, mainly around Snowflake. Motomura now leads a new business that helps companies put their data to use.
The problem of "dashboards as a CSV download feature"
While supporting data platforms, Motomura has seen many cases where BI products were introduced but the dashboards went unused. The data was all in place, but it never reached its exit. Something felt off.
Even when we built a polished dashboard, hardly anyone looked at it. People downloaded the CSV and analyzed it on their own machines. The dashboard had turned into "a feature for downloading CSVs," and that was a big problem for us.
In Squadbase, each person can build their own dashboards. Even if shared dashboards go unused, how people use dashboards changes a lot when they built them themselves. That is where Motomura saw potential. The polish of the UX and the speed of updates were also points Motomura valued.
In June, NTT DATA and Squadbase announced a partnership in conversational data visualization AI. The plan is to roll out to NTT DATA's customer base, not just handing over the product but including hands-on support. The aim is a world where frontline teams can use data without going through data engineers or BI engineers.
NTT DATA's tech blog has also published a validation article in which they actually tried Squadbase (Japanese).
Building dashboards from Snowflake data: trying the conversational BI "Squadbase"
At the networking session, trying the new UX in development

At the networking session, we set up devices where attendees could try "Data speaks first", which is still in development, and the Squadbase development team joined as well. We heard directly from attendees about their impressions of the new UX and how they use Squadbase day to day.
What's next: a kickoff, a working group, and Meetup #1
Here is what we have planned for the community.
| When | What |
|---|---|
| October | Core member kickoff meeting |
| Around November | Working group: "Thinking about the product roadmap" (working title) |
| Late November | Squadbase Community Meetup #1 |
We'll share specific dates and details as soon as they're decided. Whether you use Squadbase every day or are just starting to take on data, we'd love for you to join.
Closing
From the product vision to field use cases, tips, and business results, our first community event reminded us that everyone, in their own place, is working to "make their work better with data." Thank you to the speakers, to NTT DATA for providing the venue, and to everyone who joined us.
Squadbase is developing "Data speaks first" toward the GA release at the end of October. At Meetup #1 in November, we expect to share how it has evolved since, along with new use cases. We hope to see you at the venue next time!