Pandas Data Analyst
Overview
The Pandas Data Analyst AI Copilot is an interactive data analysis application built on Streamlit. By uploading a CSV or Excel file and asking questions in natural language, users can leverage OpenAI’s LLM alongside Business Science’s specialized agents to automatically generate data tables and interactive charts. This tool lowers the barrier to exploratory data analysis (EDA) and visualization, making it accessible not only to seasoned data scientists but also to business users and analysts with minimal coding experience.
This project is a customization of the original Exploratory Data Analysis Copilot App published by Business Science, tailored specifically for Squadbase.
Architecture and Workflow
1. App Initialization
Upon launch, the app configures its page metadata and provides a concise introduction to guide users:
st.set_page_config(
    page_title="Pandas Data Analyst AI Copilot",
    page_icon="📊",
)
st.title("Pandas Data Analyst AI Copilot")
st.markdown("""
Upload a CSV or Excel file and ask questions about the data.
The AI agent will analyze your dataset and return either data tables or interactive charts.
""")
This setup ensures users immediately understand the app’s purpose and how to begin.
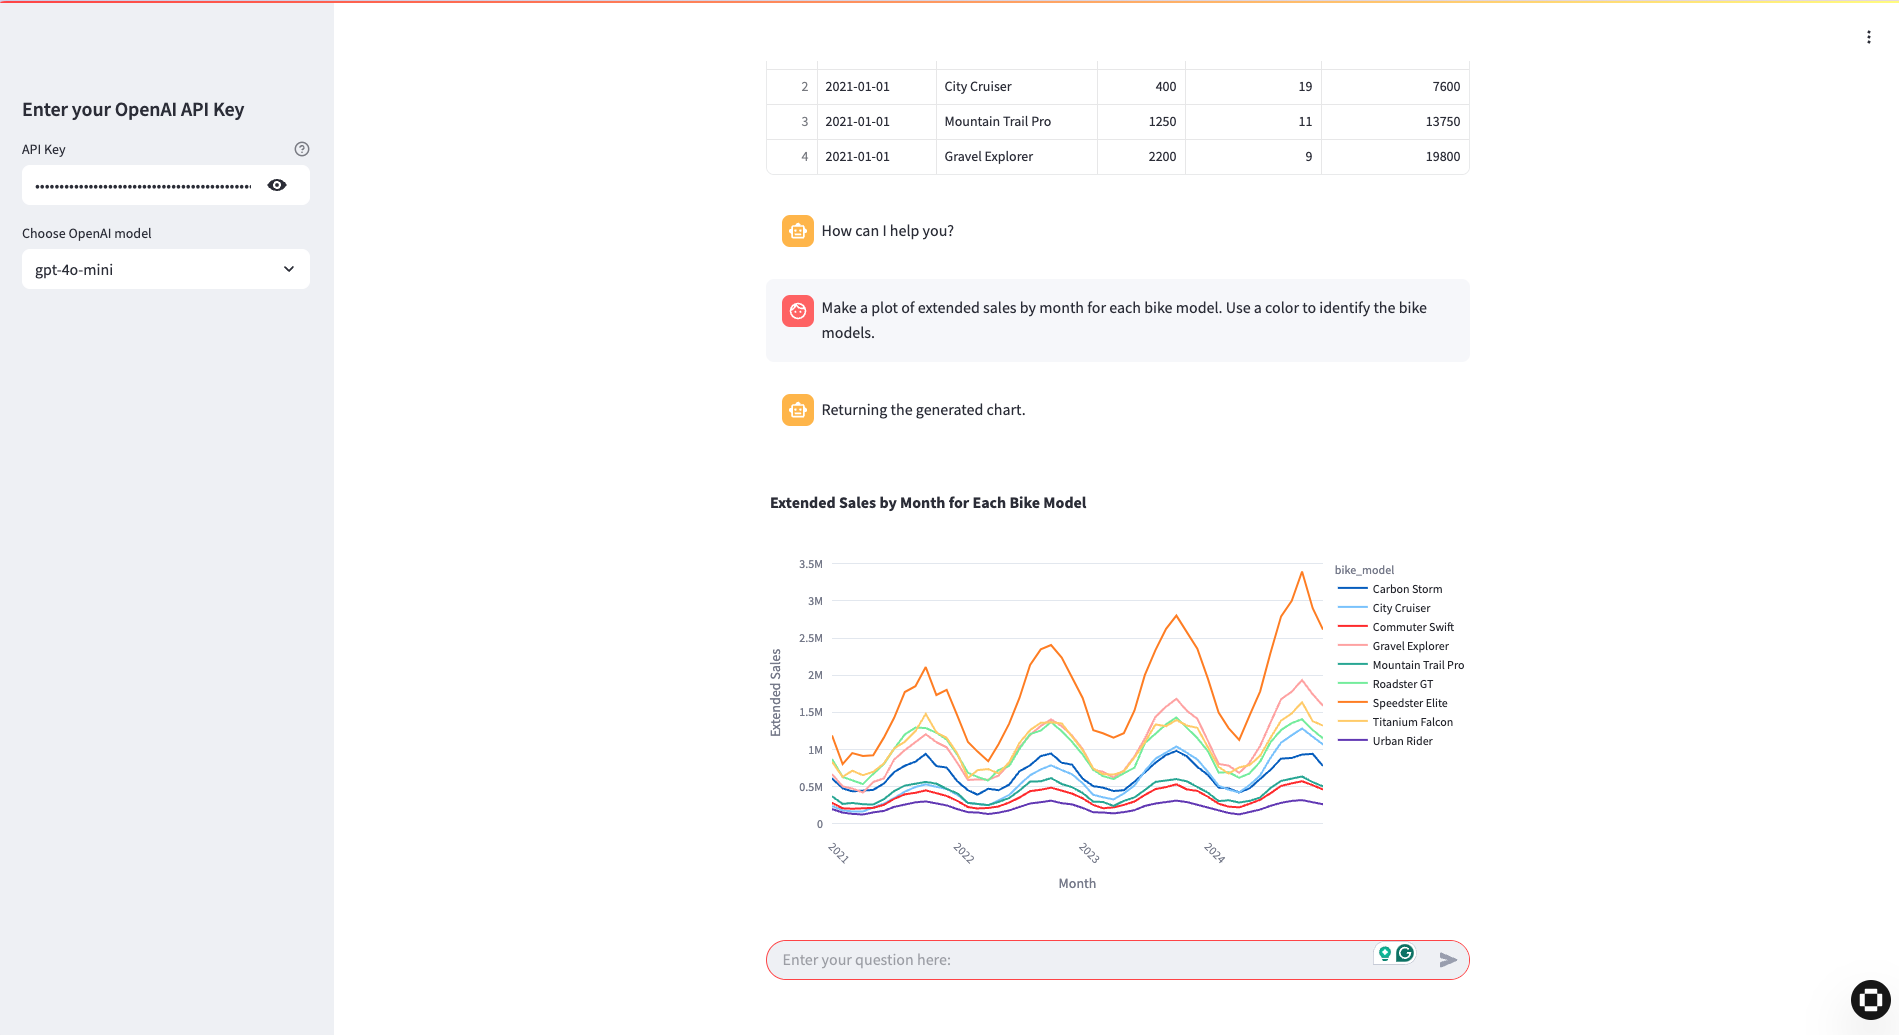
2. OpenAI API Key Entry & Model Selection
A sidebar widget prompts users to enter their OpenAI API key, validates it, and offers a choice between models (gpt-4o-mini or gpt-4o), allowing for cost/performance trade-offs:
st.sidebar.header("Enter your OpenAI API Key")
st.session_state["OPENAI_API_KEY"] = st.sidebar.text_input("API Key", type="password")
model_option = st.sidebar.selectbox("Choose OpenAI model", ["gpt-4o-mini", "gpt-4o"])
3. File Upload & Data Preview
Users upload a CSV or Excel file, which is read into Pandas and displayed in a preview. This immediate feedback confirms that the correct dataset has been loaded:
uploaded_file = st.file_uploader("Choose a CSV or Excel file", type=["csv","xlsx","xls"])
if uploaded_file is not None:
    df = pd.read_csv(uploaded_file) if uploaded_file.name.endswith(".csv") else pd.read_excel(uploaded_file)
    st.subheader("Data Preview")
    st.dataframe(df.head())
else:
    st.info("Please upload a CSV or Excel file to get started.")
    st.stop()
4. Chat History Management
The app uses StreamlitChatMessageHistory to maintain a conversation log. Special tags in AI responses (PLOT_INDEX: or DATAFRAME_INDEX:) allow the app to re-render past charts and tables seamlessly:
def display_chat_history():
    for msg in msgs.messages:
        with st.chat_message(msg.type):
            # Detect and render past charts or dataframes based on tags
            …
5. AI Agent Integration
Three core agents—PandasDataAnalyst, DataWranglingAgent, and DataVisualizationAgent—are instantiated with the chosen LLM. When a user submits a question, these agents collaborate to preprocess the data, generate visualizations, and summarize results:
pandas_data_analyst = PandasDataAnalyst(
    model=llm,
    data_wrangling_agent=DataWranglingAgent(model=llm, …),
    data_visualization_agent=DataVisualizationAgent(model=llm, …),
)
How to Use
- Enter your OpenAI API key and select the desired model in the sidebar.
- Upload your CSV or Excel file and verify the preview to ensure data integrity.
- Ask a question in the chat box, such as “Show me the top five products by sales.”
- View the AI’s response as an interactive table or chart.
- Iterate with follow-up questions to dive deeper into your data.
Customization
Tailor the Pandas Data Analyst AI Copilot to your organization’s needs by extending each phase of the workflow:
1. Enhanced Data Input & Preprocessing
-
Support Additional Formats Allow JSON and Parquet alongside CSV/Excel:
uploaded_file = st.file_uploader("Choose a file", type=["csv","xlsx","json","parquet"]) if uploaded_file.name.endswith(".json"): df = pd.read_json(uploaded_file) elif uploaded_file.name.endswith(".parquet"): df = pd.read_parquet(uploaded_file) else: # Existing CSV/Excel logic -
Preprocessing Pipeline Insert a shared
preprocess(df)function immediately after loading to handle missing values, parse dates, and enforce schema consistency:def preprocess(df: pd.DataFrame) -> pd.DataFrame: # e.g., fill missing values, convert date columns return df df = preprocess(df) st.session_state["DATA_RAW"] = df.copy()
2. Agent & Model Logic Extensions
-
Agent Selection Introduce a sidebar option to choose between a default EDA agent, a statistics-focused agent, or a visualization-only agent:
agent_type = st.sidebar.selectbox("Agent Type", ["Default", "Stats", "Viz"]) if agent_type == "Stats": analyst = PandasDataAnalyst(model=llm, data_wrangling_agent=StatsAgent(llm), …) elif agent_type == "Viz": analyst = PandasDataAnalyst(model=llm, data_visualization_agent=VizAgent(llm), …) else: analyst = PandasDataAnalyst(model=llm, …) -
Custom LLM Integrations Wrap the
ChatOpenAI(model=…)instantiation to support internal fine-tuned models or retrieval-augmented deployments, enabling domain-specific inference.
3. Report & Export Features
-
Downloadable Reports Add buttons below chat artifacts to export the session as PDF, PowerPoint, or Excel using libraries like
reportlaborpython-pptx:if st.button("Download PPTX Report"): pptx_bytes = generate_pptx(msgs.messages, st.session_state["plots"], st.session_state["dataframes"]) st.download_button("Here is your PPTX", data=pptx_bytes, file_name="analysis_report.pptx") -
Template-Driven Layouts Prepare Jinja2 or PowerPoint templates to standardize section order, branding, and styling before rendering.
Summary
By combining no-code natural language interaction with powerful data-wrangling and visualization agents, the Pandas Data Analyst AI Copilot transforms how organizations extract insights from their data. Its modular architecture makes it highly extensible: start with core features and incrementally enhance data ingestion, agent logic, and reporting to build a bespoke analytics platform perfectly aligned with your workflows.