Exploratory Data Analysis (EDA) Copilot
Overview
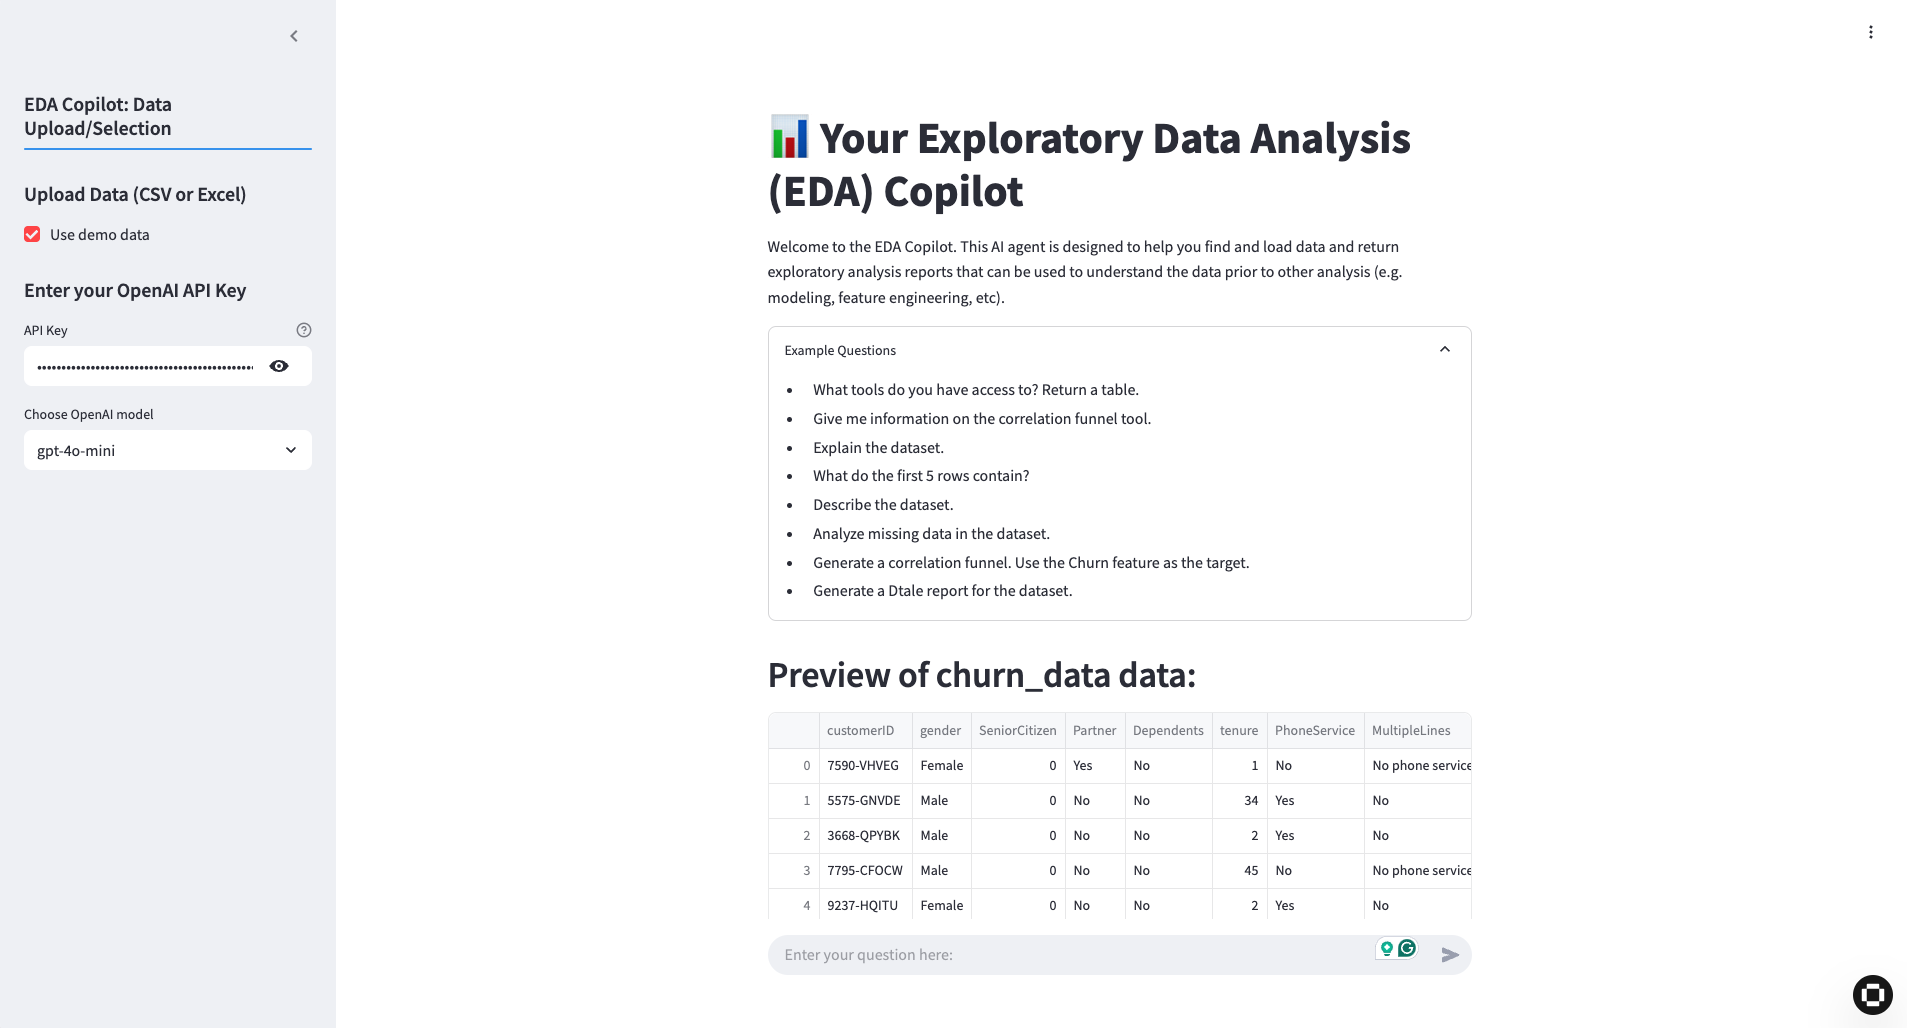
The EDA Copilot app provides an interactive experience where users can upload a dataset (CSV or Excel) and receive exploratory data analysis (EDA) reports generated and displayed in response to natural-language queries. On the backend, OpenAI’s LLM is combined with the Business Science team’s EDAToolsAgent to dynamically produce various visualizations, summaries, and analytical insights.
This project is a customization of the original Exploratory Data Analysis Copilot App published by Business Science, tailored specifically for Squadbase.
Customization
Below we focus on three key areas—Generalizing data ingestion/preprocessing, Extending AI agent/model logic, and Enhancing report/export functionality—and explain exactly which parts of the code to modify.
1. Generalizing Data Ingestion / Preprocessing
By supporting not only CSV and Excel but also databases, cloud storage, and API-streamed data, you can meet diverse real-world needs. Adding options for missing-value imputation and type conversion at load time will normalize the data into a consistent format and boost the accuracy of your analysis agent’s responses.
Relevant code snippet
uploaded_file = st.sidebar.file_uploader(
    "Upload CSV or Excel file", type=["csv", "xlsx"]
)
…
st.session_state["DATA_RAW"] = df.copy()
Example customizations
-
Support additional input formats
- Extend the
typeargument ofst.sidebar.file_uploaderto["csv", "xlsx", "json", "parquet"]. - Branch on file extension to call
pd.read_jsonorpd.read_parquetas needed.
- Extend the
-
Insert a preprocessing pipeline
-
Immediately after
df.copy(), invoke a shared function:df = preprocess(df) st.session_state["DATA_RAW"] = df.copy() -
In
preprocess(df), perform missing-value imputation, parse date columns, cast types, etc.
-
2. Extending AI Agent / Model Logic
Make the choice of LLM or agent (LangChain, RAG, fine-tuned models, etc.) pluggable via a sidebar selection. For instance, you could run a lightweight descriptive-statistics agent alongside a visualization-specialist module, then route each question to the optimal agent for more precise results.
Relevant code snippet
def process_exploratory(question: str, llm, data: pd.DataFrame) -> dict:
    eda_agent = EDAToolsAgent(
        llm,
        invoke_react_agent_kwargs={"recursion_limit": 10},
    )
    …
    eda_agent.invoke_agent(...)
Example customizations
-
Agent-switching mechanism Add a selectbox in the sidebar for “Agent Type”:
agent_type = st.sidebar.selectbox("Agent Type", ["EDA", "Stats", "Viz"]) if agent_type == "Stats": from ai_data_science_team.ds_agents import StatsAgent agent = StatsAgent(llm) elif agent_type == "Viz": from ai_data_science_team.ds_agents import VizAgent agent = VizAgent(llm) else: agent = EDAToolsAgent(llm, ...) -
Plugin support for LLM models Wrap the
ChatOpenAI(model=model_option, …)instantiation so users can choose an in-house fine-tuned model or a RetrievalLLM for RAG workflows.
3. Enhancing Report / Export Functionality
Allow users to download the generated charts, tables, and HTML report as PDF, PowerPoint, or Excel files on the spot—making it easy to distribute internally or reuse in presentations. By introducing report templates with fixed layouts and sections, you can automate routine reporting while maintaining consistent quality.
Relevant code snippet
# Immediately after displaying final artifacts
if artifact_list:
    st.session_state["chat_artifacts"][msg_index] = artifact_list
display_chat_history()
Example customizations
-
Insert PDF / PowerPoint export Before calling
display_chat_history(), or under each artifact, add a download button:if st.button("Download PDF Report"): pdf_bytes = generate_pdf(msgs.messages, st.session_state["chat_artifacts"]) st.download_button("Here is your report", data=pdf_bytes, file_name="EDA_report.pdf")Implement
generate_pdfin a separate module using libraries likereportlaborpython-pptx. -
Template-driven rendering Prepare Jinja2 templates for HTML reports and render them just before
render_report_iframe. For PowerPoint, load a slide template and inject figures and text into predefined placeholders.
By structuring your customization around the three phases—Data Ingestion → Agent Selection → Report Output—and adding hooks at the corresponding code locations, you can incrementally extend the app to fit your organization’s data workflows and use cases. Start by making small changes in one area, verify functionality, and then proceed to the next enhancement.