Best AI Dashboard Builder 2025-2026: Complete Guide

In 2026, Dashboards Are Generated, Not Built
Dashboard creation has changed. In 2026, generative AI powers the entire system—not just as an add-on feature in Business Intelligence. AI dashboard generators now handle everything from data connections to charts.
Many teams ask the same question. Should they try newer AI dashboard builders that create dashboards from simple prompts? Or stick with tools like Tableau AI or ThoughtSpot?
The right answer depends on what matters most to your team: speed and flexibility, or strong control and security.
This guide covers both paths—a newer approach called Vibe Analytics and traditional BI tools with AI capabilities—so that by the end, you will know which dashboard builder fits your needs in 2025-2026.
What Is an AI Dashboard Builder?
An AI dashboard builder is a tool that uses artificial intelligence to help you create dashboards with key metrics and charts; instead of using traditional drag-and-drop interfaces to place bar charts manually, you can describe what you want and the AI generates the dashboard for you.
Some tools use generative AI as the core engine from the start. Others add AI assisted features to existing BI platforms. Both can save time, but they work in very different ways.
Let's look at the two main types of dashboarding tools.
Two Approaches to AI Dashboards
The AI dashboard market has split into two distinct camps, and understanding the difference between them is essential for selecting the right tool.
Vibe Analytics (Squadbase)
This newer approach to building AI dashboards draws from the concept of "Vibe Coding," a term coined by AI researcher Andrej Karpathy, which means letting generative AI do the heavy lifting while you guide it with simple prompts.
With Vibe Analytics, rather than building dashboards piece by piece, you simply tell the AI what you want to see, and it generates everything—database connections, design, and interactive dashboard features.
What it offers:
- Goal-first creation: Start with what you want to achieve, and the AI determines the rest.
- Complete application output: You receive more than bar charts—you get a working data app with buttons, filters, and actions.
- Proactive recommendations: The AI analyzes your existing dashboards and data as a whole, surfacing insights and ideas you didn't think to ask for without requiring additional effort.
- Rapid results: Go from concept to working interactive dashboard in minutes rather than months.
This approach works even with messy or scattered data sources, without requiring a large IT team or months of preparation.
Business users can create the tools they need independently—no coding skills required. Simply describe what you want to track, and the AI builds it for you.
Who should use this: Business owners, DX teams, startups, and anyone who needs fast results. If you have a question about your data right now, Vibe Analytics can give you an answer today—not next quarter.
Traditional BI with AI (Tableau AI, ThoughtSpot)

Source: Tableau Next
These enterprise-grade, well-established platforms have built up years of market presence, and they now layer AI features and capabilities on top of their existing functionality.
What they offer:
- Natural language querying: You type a question in plain English, and the tool returns a chart with the answer.
- Automated insights: The AI identifies patterns in your data models and highlights what stands out.
- Robust controls: You can define who sees what, access audit logs, and satisfy compliance requirements.
- User-driven exploration: While you still need to know what questions to ask, the AI accelerates the process of finding answers.
These tools work best when you have an established data team with clean, well-organized data models.
Setup can take weeks or months—you need to map your data, configure user roles, and train your team. However, once up and running, these platforms handle enterprise-scale teams and strict governance requirements effectively.
Who should use this: Large companies with data analysts, IT support, and compliance needs. If your company has strict rules about data access, these tools give you the control you need.
AI Dashboard Builder Comparison: Vibe Analytics vs Traditional BI
The primary difference lies not in what these tools can do, but in how they operate.
Vibe Analytics starts with your goal, and the AI constructs what you need.
Traditional BI takes a bottom-up approach: you build a data layer first, then add charts on top.
Here is a side-by-side look at the two approaches:
Visual comparison of the two approaches to AI dashboards
| Aspect | Vibe Analytics (Squadbase) | Tableau AI / ThoughtSpot |
|---|---|---|
| How You Build | Goal-first: Start with what you need, AI handles the rest | Bottom-up: Start with clean data, then add charts |
| Main Users | Business owners and DX teams | Data analysts and IT teams |
| Flexibility | Open-ended via AI-generated code | Tied to built-in options |
| Setup Cost | Low (connect your database and start) | High (licenses and setup work) |
| Speed | Minutes to hours | Weeks to months |
| 2026 Focus | Building new apps on demand | Explaining existing reports |
Both approaches offer distinct advantages, and the right choice depends on your team's capabilities and objectives.
Best AI Dashboard Builders 2025-2026
Here is a closer examination of the top AI dashboard tools available today, each taking a distinct approach.
While some prioritize speed and ease of use, others focus on search and exploration—select the one that matches how your team operates.
Top AI dashboard builders: Squadbase, ThoughtSpot and Tableau
Squadbase — The Vibe Analytics Platform
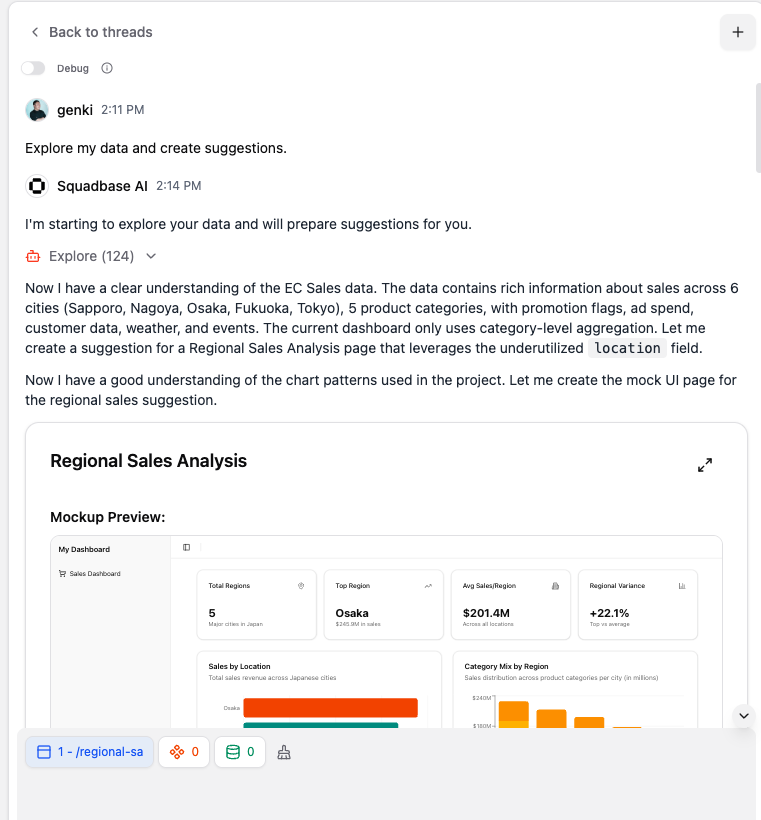
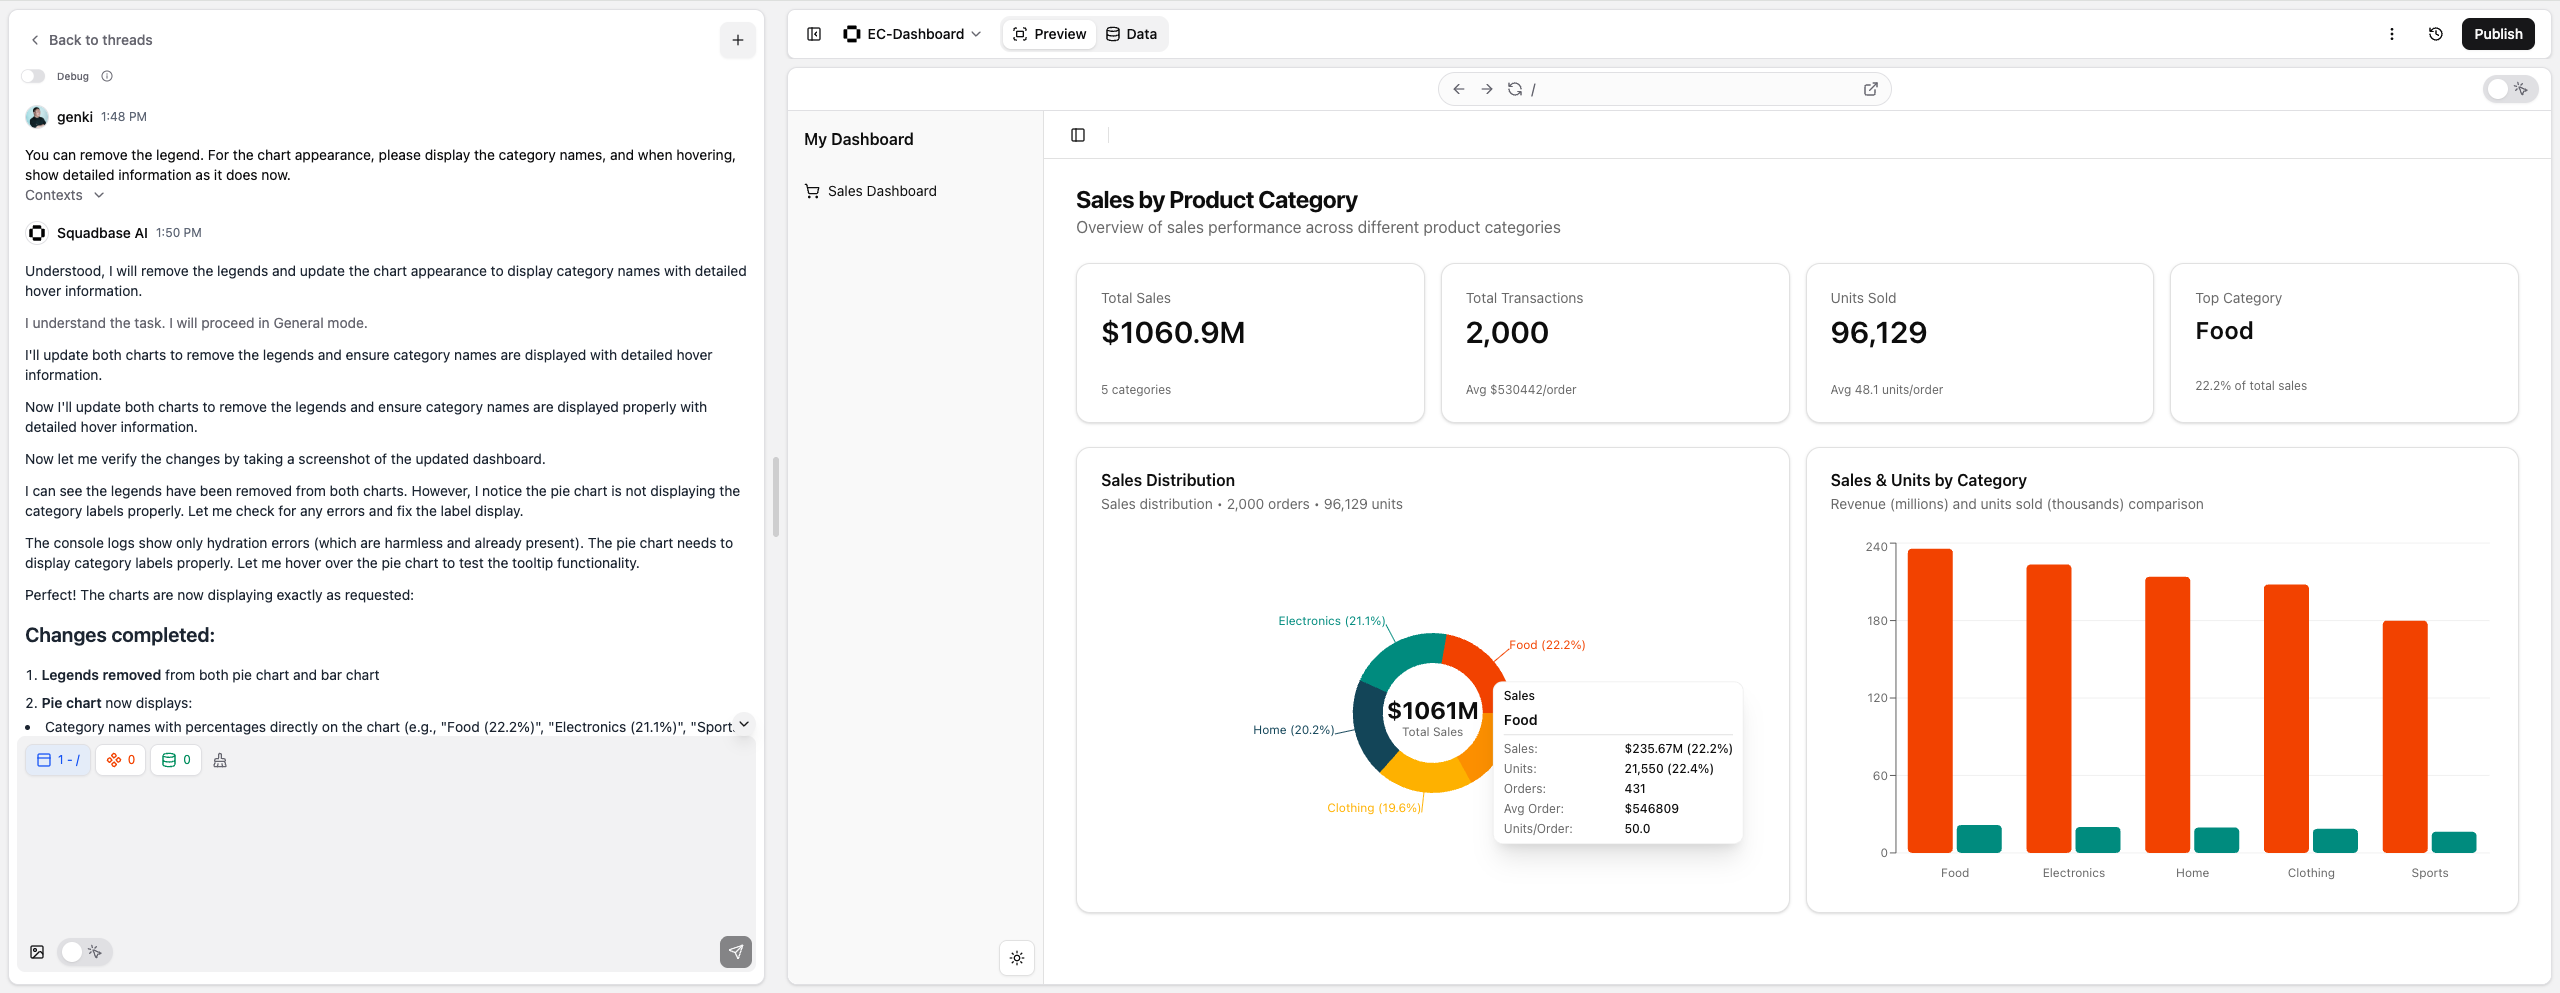
Squadbase takes a different path by using the Vibe Analytics approach from the ground up, which means AI is not an add-on but rather the core of how the tool operates.
You describe what you need in plain words—for example, "Show me sales by region for the last 90 days with a filter for product type"—and Squadbase constructs a complete data application, not just a static chart.
The output includes filters, buttons, and live data—the AI writes the code behind the scenes, allowing you to tweak the result or deploy it as-is.
What it does well:
- Fastest path from idea to working app
- No BI skills needed
- Full control via generated code
- Access control & Audit logs
Things to know:
- Newer platform with a growing user base
- Best for teams that value speed over process
- Less suited for rigid compliance workflows
Pricing: Starts at $35 per creator per month and viewers are free.
ThoughtSpot — The Search-First Pioneer
 Source: ThoughtSpot
ThoughtSpot made its name with search-based BI and natural language querying. You type a question like you would in a search engine, and the tool returns a chart displaying your key metrics.
Their AI layer, called ThoughtSpot Sage, now uses large language models. This creates a more chat-like experience where you can ask follow-up questions and conduct granular analysis on your data models.
What it does well:
- Fast search across large data sets
- Built for large teams
- Strong data rules and access controls
Things to know:
- Your data must be well-modeled before you can get good results
- Setup takes time and money—plan for a multi-month rollout
- Best for companies with data teams who can maintain the system
Pricing: Enterprise-level. Contact sales for quotes. Most plans run into five figures per year.
Tableau AI — The Enterprise Standard

Source: Tableau Pulse
Tableau is one of the most-used BI tools in the world. It now offers AI features like Tableau Pulse. These features send you alerts when data changes and suggest insights you might have missed.
Tableau connects to Salesforce, which owns it. This makes it a strong choice if you use Salesforce products.
What it does well:
- Industry-leading charts and graphs
- Huge user community and resources
- Works well with Salesforce tools
Things to know:
- Pricing is complex
- Learning curve for advanced features
- Needs IT support for best results
Pricing: Starts around $70 per user per month for basic plans.
How to Choose the Right AI Dashboard Builder
Not sure which tool fits your team? Answer these three questions to determine the right type of AI dashboard builder for your needs.
Use this flowchart to find the right AI dashboard builder for your team
Question 1: What Is Your Budget and Timeline?
Be honest about your resources: do you need results this week on a lean budget, or do you have months and a substantial budget?
- Days + small budget: Squadbase gets you live fast.
- Months + large budget: Tableau AI or ThoughtSpot deliver enterprise power.
Question 2: Who Will Use the Dashboards?
Consider your primary users: are they field teams who need to explore data on the fly, or executives who want fixed reports?
- Dynamic views for field teams: Vibe Analytics gives speed and freedom.
- Fixed reports for leaders: Traditional BI gives strong control and polish.
Question 3: Is Your Data Warehouse Fully Prepared?
Do you use Snowflake, BigQuery, or a similar data warehouse with well-maintained semantic layers, clean data models, and dedicated data teams?
- Partially or not yet: Vibe Analytics works well with data warehouses at any stage—even raw or loosely organized data.
- Yes, fully prepared: Traditional BI tools can leverage your mature data infrastructure for immediate value.
The AI dashboard market will keep growing in 2026. New tools will emerge, and existing platforms will expand their AI capabilities. But the fundamental choice remains the same: speed versus control. Pick the path that fits your team, and start building.